Analysis of Monday's Trades
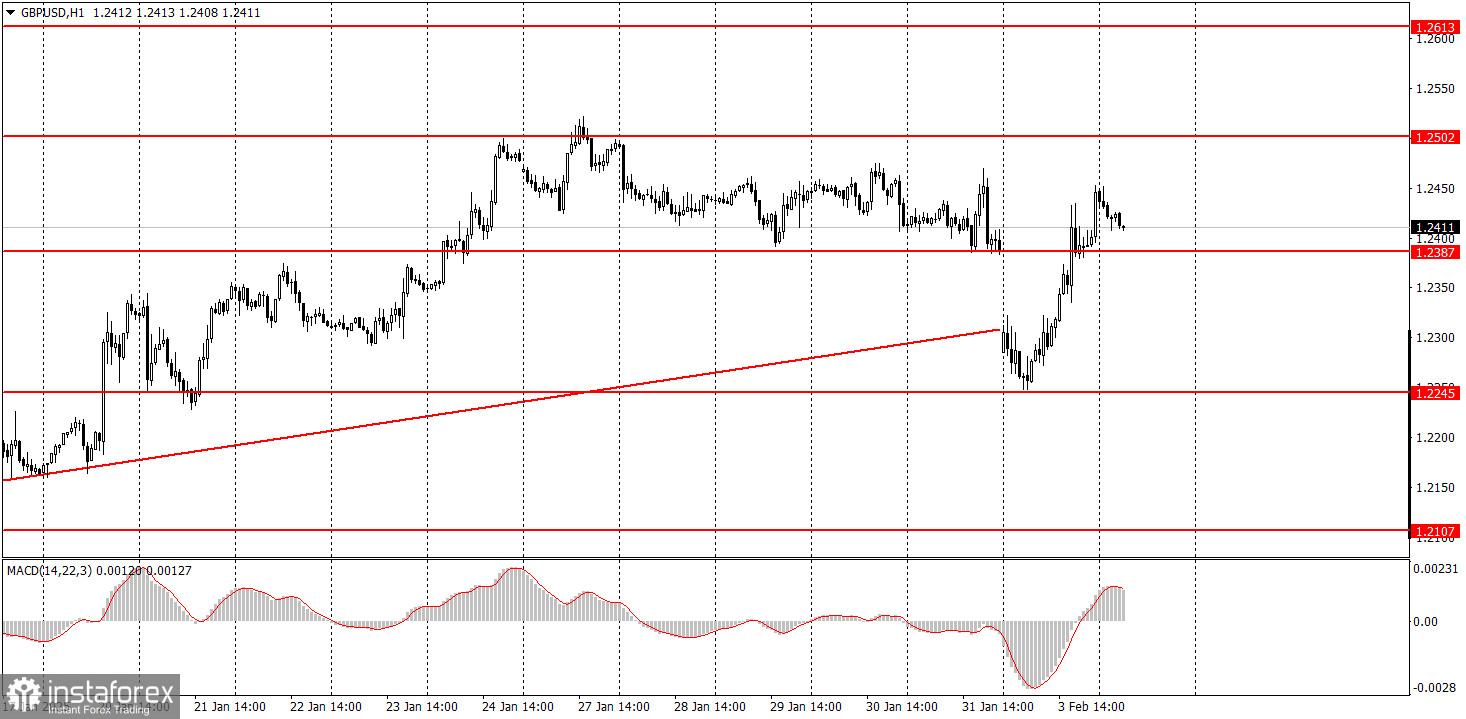
1H Chart of GBP/USD
On Monday, the GBP/USD pair experienced a significant drop at the market open but managed to recover by the end of the day. Although the ascending trendline was broken, we believe this breakout should not be taken seriously. The price movement on that day was impulsive and driven by emotion, which is often the case following central bank meetings—prices tend to move in one direction, only to return to their original positions the next day. Therefore, it can be said that Monday's fluctuations confused traders and complicated the technical outlook. The upward correction continues, while the medium-term downtrend remains intact. The ISM Manufacturing PMI from the U.S. was much more positive than traders expected, which could indicate that the dollar might resume its growth today. However, we must emphasize that the market is currently reacting emotionally, and it is uncertain what further information might come from Trump.
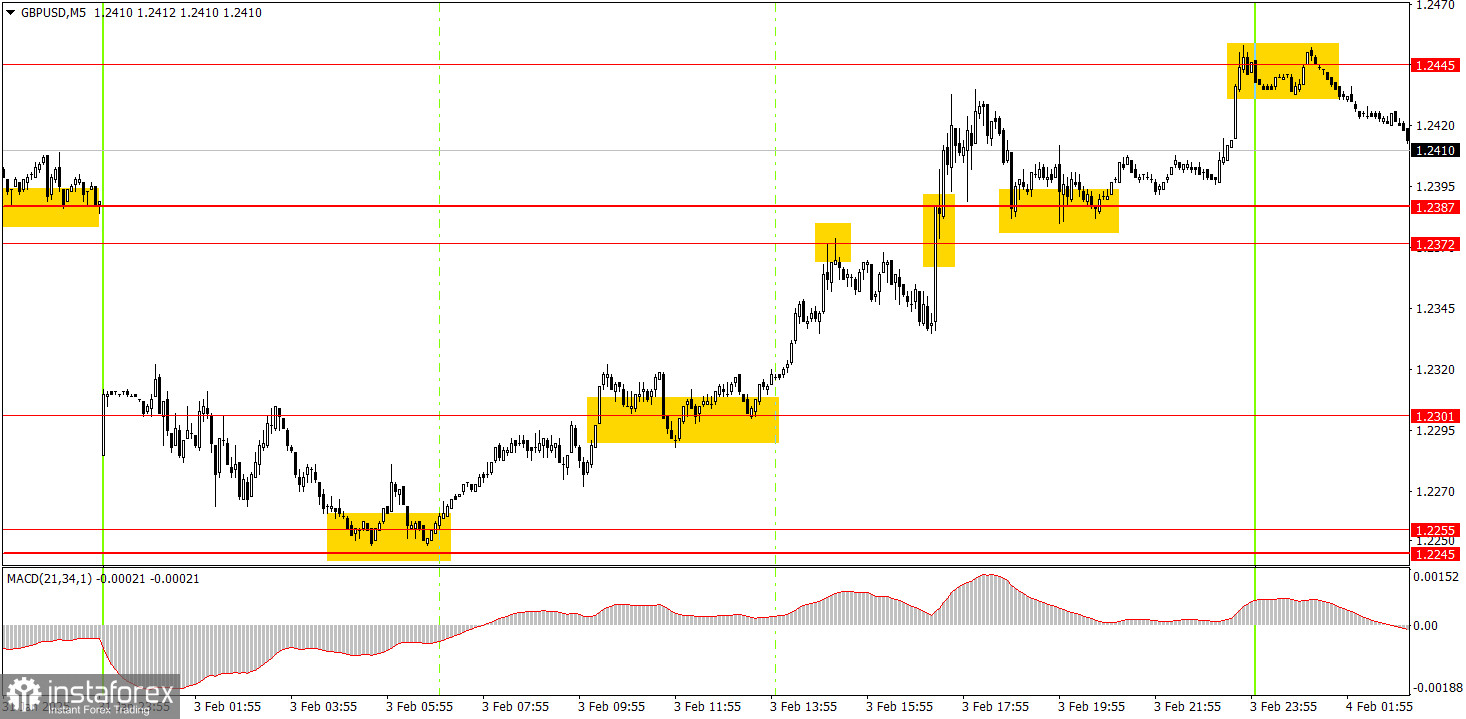
5M Chart of GBP/USD
On the 5-minute timeframe, the currency pair generated numerous signals on Monday. In the early morning, the pair rebounded from the 1.2245-1.2255 range, initiating a sustained upward movement. The 1.2302 level was breached easily, but a false sell signal emerged around the 1.2372-1.2387 area, which caused traders to exit their long positions prematurely. Fortunately, this signal did not lead to any losses, as the price moved 20 points in the intended direction afterward. Following this, two additional buy signals formed in the same area, and the nearest target level of 1.2445 was successfully reached. Another sell signal appeared near this level, and this time it was accurate.
Trading Strategy for Tuesday:
On the hourly timeframe, the GBP/USD pair continues to form a short-term uptrend, which essentially represents a correction. In the medium term, we fully expect the pound to decline toward the 1.1800 level, as we believe this is the only logical outcome. Therefore, it is now simply a matter of waiting for the decline to resume. This week's movements may be volatile and challenging to interpret.
On Tuesday, the GBP/USD pair may very well begin to move downward again. It could continue the sideways movement observed last week or even extend its upward trend. Ultimately, everything will depend on market sentiment and reactions to Trump's decisions.
On the 5-minute timeframe, you can trade based on the following levels: 1.2010, 1.2052, 1.2089-1.2107, 1.2164-1.2170, 1.2241-1.2270, 1.2301, 1.2372-1.2387, 1.2445, 1.2502-1.2508, 1.2547, 1.2633, 1.2680-1.2685, 1.2723, and 1.2791-1.2798. No significant events are scheduled in the UK on Tuesday, while in the U.S., the ADP report on private sector employment will be released.
Core Trading System Rules:
- Signal Strength: The shorter the time it takes for a signal to form (a rebound or breakout), the stronger the signal.
- False Signals: If two or more trades near a level result in false signals, subsequent signals from that level should be ignored.
- Flat Markets: In flat conditions, pairs may generate many false signals or none at all. It's better to stop trading at the first signs of a flat market.
- Trading Hours: Open trades between the start of the European session and the middle of the US session, then manually close all trades.
- MACD Signals: On the hourly timeframe, trade MACD signals only during periods of good volatility and a clear trend confirmed by trendlines or trend channels.
- Close Levels: If two levels are too close (5–20 pips apart), treat them as a support or resistance zone.
- Stop Loss: Set a Stop Loss to breakeven after the price moves 20 pips in the desired direction.
Key Chart Elements:
Support and Resistance Levels: These are target levels for opening or closing positions and can also serve as points for placing Take Profit orders.
Red Lines: Channels or trendlines indicating the current trend and the preferred direction for trading.
MACD Indicator (14,22,3): A histogram and signal line used as a supplementary source of trading signals.
Important Events and Reports: Found in the economic calendar, these can heavily influence price movements. Exercise caution or exit the market during their release to avoid sharp reversals.
Forex trading beginners should remember that not every trade will be profitable. Developing a clear strategy and practicing proper money management are essential for long-term trading success.