The GBP/USD currency pair experienced a period of stagnation for most of Tuesday. On Monday evening and Tuesday morning, bulls attempted to push the pound sterling higher, but their efforts quickly faded despite relatively positive data from the UK.
Last week, we highlighted two key points. First, the British currency lacked substantial fundamental reasons to rise by nearly 250 pips. Second, an upward movement still appeared to be the most logical scenario, as the ongoing correction on the daily timeframe was still in play. This created a paradox: there were no strong macroeconomic or fundamental reasons for growth, yet the pair continued to rise.
However, this week, the market has been slow to buy the pound. The euro is on the brink of entering a prolonged flat phase, and in this scenario, it is unlikely that the pound will continue to rise independently. The euro and the pound often exhibit similar trading patterns over extended periods. On Tuesday morning, traders had valid reasons to purchase the British pound, but they did not seize the opportunity. Any macroeconomic data from the UK that signals improvement should be regarded as conditionally positive. Let's delve into this in more detail.
The most significant report released was the unemployment rate. The market expected it to rise to 4.5%, but this did not occur. Can the actual value be viewed as more positive than expected? Yes. However, can it be considered truly positive? No. Wages increased by 6%, surpassing the market's expectation of 5.9% and the previous figure of 5.5%. In theory, higher wage growth should lead to faster and stronger inflation, which could discourage the Bank of England from cutting rates at every other meeting this year. However, this is merely theoretical. In practice, the BoE is primarily focused on the condition of the economy, which has stagnated for over two years, rather than on inflation. It is worth noting that the inflation report for January is set to be released today.
The final report, jobless claims, showed a higher-than-expected number, but it was insignificant since the first two reports failed to inspire the market. As a result, while the British pound had formal reasons to rise on Tuesday, there was nothing genuinely positive in the data to sustain a rally.
The pound can still rely on a corrective movement, which may become much more complex than it is now. We do not rule out the possibility of several more cycles of growth and decline before the four-month and sixteen-year trends resume. However, it is essential to remember that any pound rally at this stage is fundamentally and macroeconomically illogical.
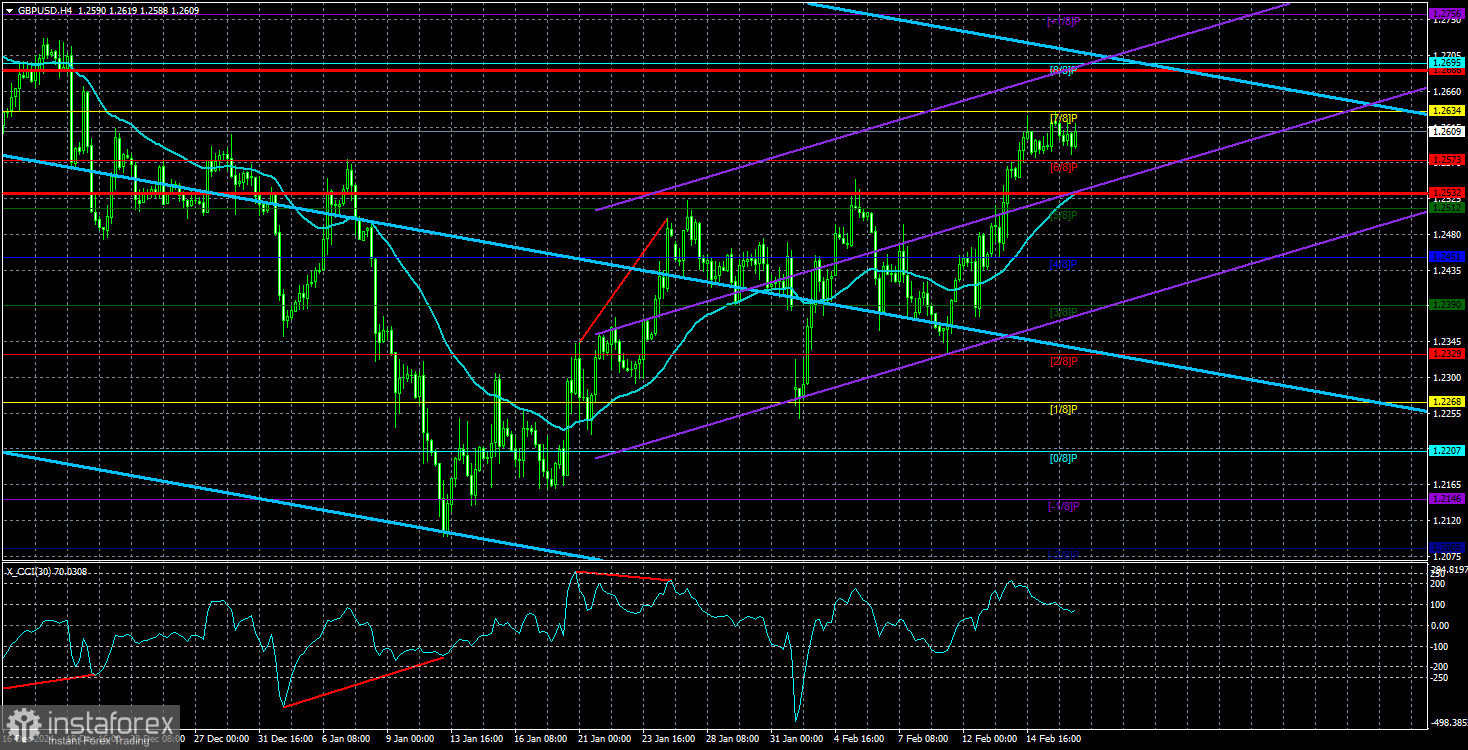
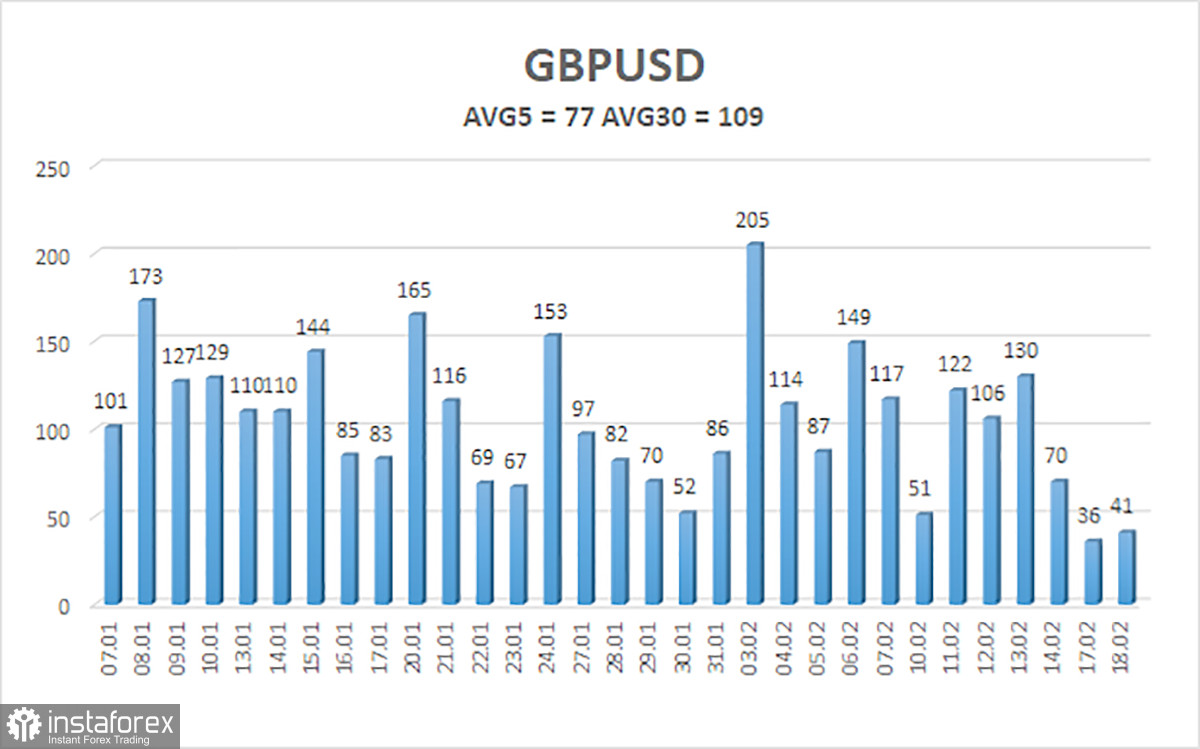
The average volatility of the GBP/USD pair over the last five trading days is 77 pips, which is considered "moderate" for this pair. On Wednesday, February 19, we expect the pair to trade within a range of 1.2532 to 1.2688. The linear regression channel still points downward, signaling a continued bearish trend. The CCI indicator last entered the oversold zone, suggesting a potential new wave of upward correction.
Nearest Support Levels:
S1 – 1.2573
S2 – 1.2512
S3 – 1.2451
Nearest Resistance Levels:
R1 – 1.2634
R2 – 1.2695
R3 – 1.2756
Trading Recommendations:
The GBP/USD pair maintains a medium-term downtrend. We still do not consider long positions, as we believe all factors supporting the British currency have already been priced in multiple times, with no new bullish catalysts. For traders using pure technical analysis, long positions may be considered with targets at 1.2686 and 1.2695, but only if the price remains above the moving average line. Short positions remain the preferred strategy, with targets at 1.2207 and 1.2146, as the upward correction on the daily timeframe will eventually end. For short positions, a confirmed consolidation below the moving average is required. The best short entries will likely come at the end of the upward correction on the daily TF, but it can last for a long time.
Explanation of Illustrations:
Linear Regression Channels help determine the current trend. If both channels are aligned, it indicates a strong trend.
Moving Average Line (settings: 20,0, smoothed) defines the short-term trend and guides the trading direction.
Murray Levels act as target levels for movements and corrections.
Volatility Levels (red lines) represent the likely price range for the pair over the next 24 hours based on current volatility readings.
CCI Indicator: If it enters the oversold region (below -250) or overbought region (above +250), it signals an impending trend reversal in the opposite direction.