EUR/USD
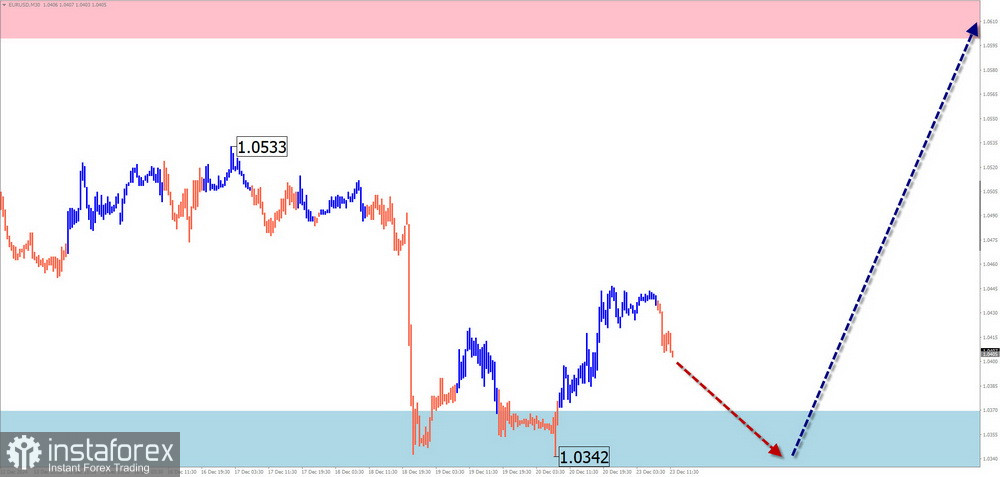
Analysis:The dominant short-term trend of the EUR/USD pair has been defined by a downward wave since late August. A corrective wave has been developing since late November in the form of a shifting flat pattern, which remains incomplete. The pair recently rebounded from intermediate support.
Forecast:At the beginning of the week, the euro is likely to move sideways along the support zone. By the end of the week, a period of calm may establish conditions for a reversal, followed by increased volatility and potential upward movement.
Potential Reversal Zones:
- Resistance: 1.0600–1.0650
- Support: 1.0370–1.0320
Recommendations:
- Selling: Consider small volume sizes for intraday trades, with gains capped at the support zone.
- Buying: Wait for confirmed reversal signals near the support zone before entering trades.
USD/JPY
Analysis:Within the global uptrend for the yen pair, the bullish wave structure starting on August 5 is still incomplete. Since late November, the final segment (C) has been forming and remains unfinished.
Forecast:The pair is expected to trade sideways near the calculated resistance zone early in the week. Increased volatility, followed by a reversal and a downward price movement, is likely later in the week. A brief breach of the resistance zone cannot be ruled out.
Potential Reversal Zones:
- Resistance: 157.80–158.30
- Support: 153.50–153.00
Recommendations:
- Buying: Avoid due to limited potential and increased risk.
- Selling: Wait for confirmed reversal signals near the resistance zone before initiating trades.
GBP/JPY
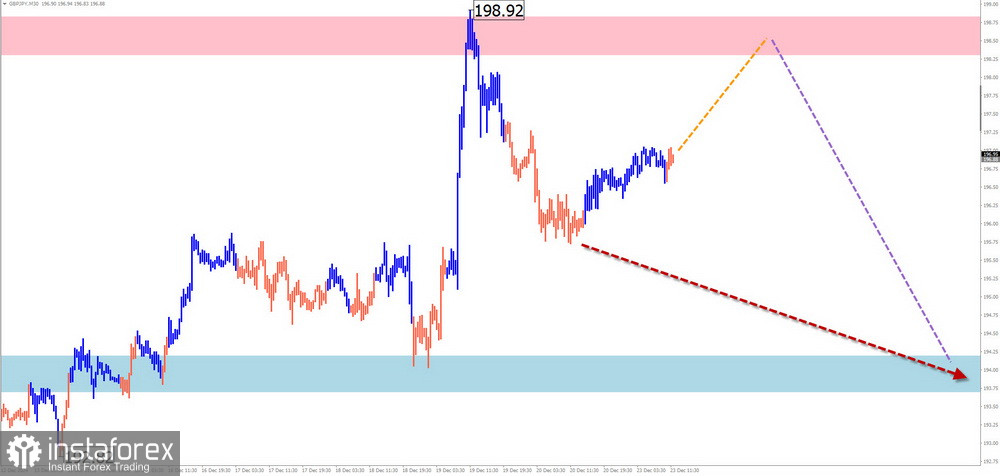
Analysis:On the 4H chart, the current upward wave remains incomplete. Since December 19, the pair has started forming a counter-directional wave with reversal potential after rebounding from intermediate resistance.
Forecast:A sideways movement with an upward bias is expected in the first half of the week, with price growth capped at the resistance zone. Sideways drifting in this zone may establish conditions for a reversal, likely leading to a decline by the end of the week.
Potential Reversal Zones:
- Resistance: 198.30–198.80
- Support: 194.20–193.70
Recommendations:
- Selling: Use small volume sizes during specific sessions, with gains capped at the support zone.
- Buying: Consider only after the current wave completes and confirmed reversal signals emerge.
USD/CAD
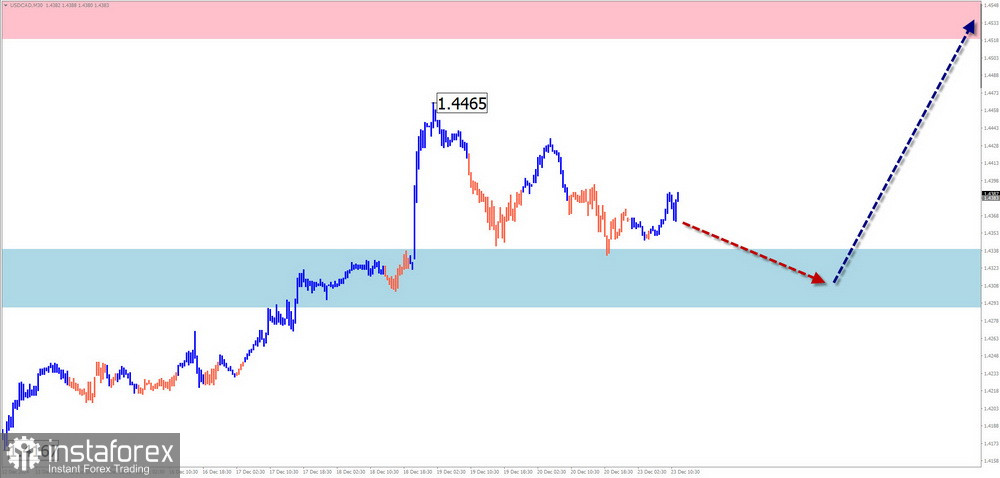
Analysis:The bullish wave structure for the Canadian dollar since October 5 is in its final phase. The final segment (C) is currently developing, with prices retracing after breaking intermediate resistance, which has now turned into support.
Forecast:A continuation of the sideways movement along the support zone is likely for the next couple of days. A reversal and resumption of the upward trend are expected afterward. Volatility may spike briefly, leading to a temporary breach of the lower support boundary.
Potential Reversal Zones:
- Resistance: 1.4520–1.4570
- Support: 1.4340–1.4290
Recommendations:
- Selling: Risky and may result in losses.
- Buying: Wait for confirmed reversal signals near the support zone before trading.
NZD/USD
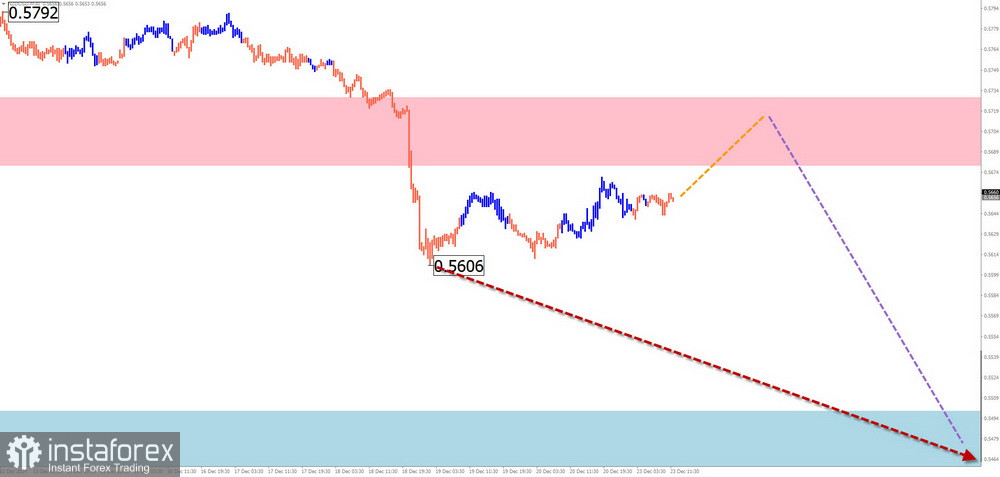
Brief Analysis:A downward trend has been developing since late September. Last week, the price broke a significant support level, now acting as resistance. Wave analysis suggests a correction is needed before the decline resumes.
Weekly Forecast:Sideways consolidation near the newly formed resistance is likely early in the week, with a potential upward bias. Pressure on the resistance zone's upper boundary is possible. Renewed price declines are expected in the second half of the week.
Potential Reversal Zones:
- Resistance: 0.5680–0.5730
- Support: 0.5500–0.5450
Recommendations:
- Selling: Premature until confirmed reversal signals appear near the resistance zone.
- Buying: High risk and potentially unprofitable.
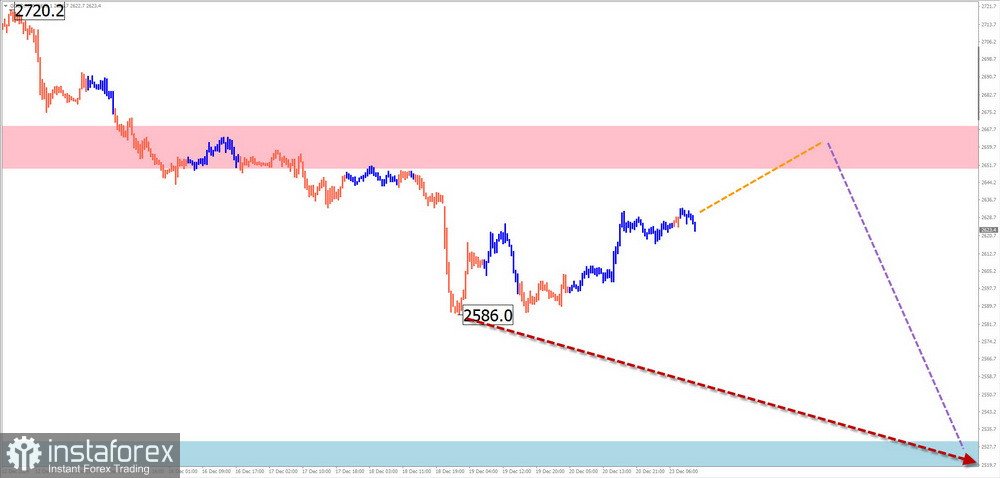
Gold
Analysis:Gold prices are forming a corrective wave pattern within the dominant uptrend since late October. The structure of this wave is incomplete, and prices are currently forming an intermediate retracement as part of the middle segment.
Forecast:A horizontal movement is likely to continue in the first days of the week, possibly with a slight price increase toward the resistance zone. Toward the week's end, conditions for a reversal and renewed bearish movement may emerge.
Potential Reversal Zones:
- Resistance: 2650.0–2670.0
- Support: 2530.0–2510.0
Recommendations:
- Buying: Small volume sizes can be used for specific trading sessions.
- Selling: Wait for confirmed reversal signals on your trading system before entering trades.
Notes on Simplified Wave Analysis:
- All waves consist of three segments (A-B-C). The analysis focuses on the last incomplete wave on each timeframe.
- Dotted lines represent expected movements.
- The wave algorithm does not account for the time duration of instrument movements.