Analysis of Thursday's Trades
1H Chart of GBP/USD
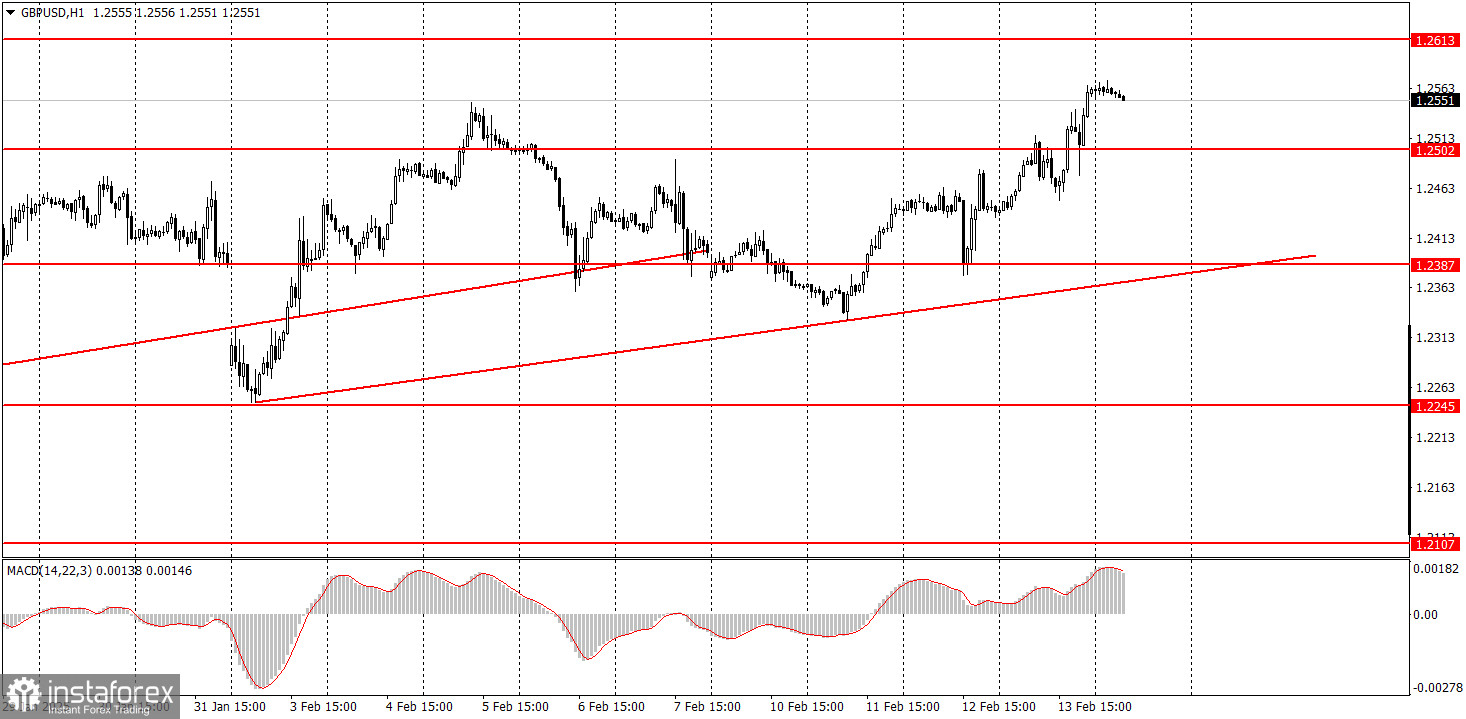
On Thursday, the GBP/USD pair continued its upward trend. Although the euro could have potentially traded higher for most of the day due to a relatively decent industrial production report—despite it not being remarkable—the pound's growth can be attributed to other factors. The UK published GDP and industrial production reports yesterday, which slightly exceeded forecasts. It's possible that the euro's strength lifted the pound as well, a phenomenon that often occurs.
However, we believe that the current upward movement of both currency pairs does not fully align with the local macroeconomic conditions and broader fundamental factors. From a technical analysis perspective, everything is logical. As mentioned previously, an upward correction continues on the daily timeframe, although it is currently very weak. Consequently, it is still incomplete, which is why the euro and the pound continue to rise stubbornly. This situation can be expected to continue freely for several more weeks.
5M Chart of GBP/USD
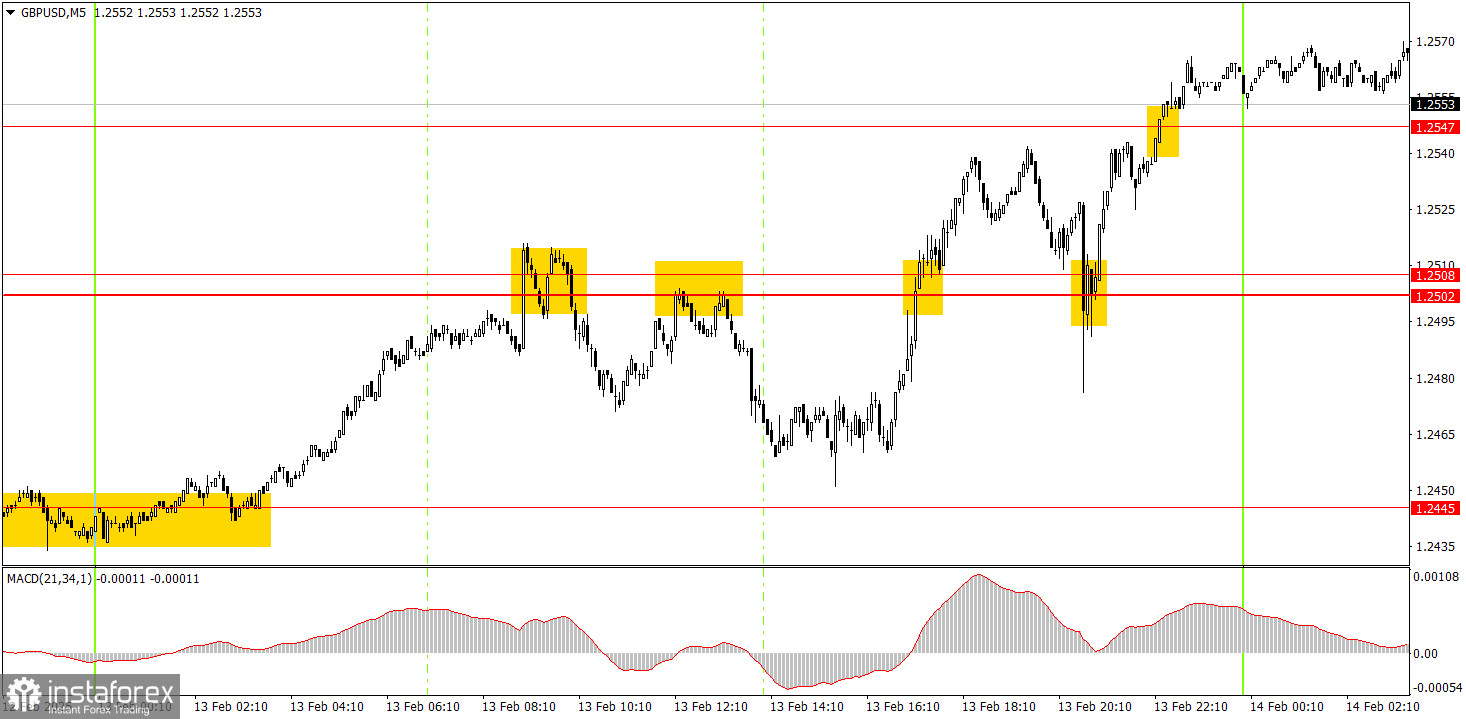
On the 5-minute timeframe, at least four trading signals were generated on Thursday, all concentrated around the 1.2502-1.2508 range. The price initially bounced twice from this zone; however, in both instances, it failed to reach the nearest target at 1.2445. Subsequently, the pound broke through this area and later bounced off it from above. It was only on the fourth attempt that the nearest target was finally reached. All four trades demonstrated good profit potential, but it was essential to close them in a timely manner.
Trading Strategy for Friday:
On the hourly timeframe, GBP/USD may begin a short-term downtrend; however, the overall movement observed over the past few weeks is still considered a correction on the daily timeframe. For the medium term, we anticipate a decline of the pound toward 1.1800, as we believe this is the only logical outcome. Therefore, it's important to wait for the upward correction on the daily timeframe to conclude.
On Friday, GBP/USD could initiate another downward movement due to the ongoing chaotic market conditions. The pound has risen over the past two days without any solid justification, and it could just as easily decline today. Currently, there seems to be little logic behind the price movements.
On the 5-minute timeframe, trading opportunities may present themselves around the following levels: 1.2010, 1.2052, 1.2089-1.2107, 1.2164-1.2170, 1.2241-1.2270, 1.2301, 1.2372-1.2387, 1.2445, 1.2502-1.2508, 1.2547, 1.2633, 1.2680-1.2685, 1.2723, and 1.2791-1.2798. For Friday, there are no significant events scheduled in the UK. However, in the U.S., important reports on industrial production and retail sales will be released, which warrant attention.
Core Trading System Rules:
- Signal Strength: The shorter the time it takes for a signal to form (a rebound or breakout), the stronger the signal.
- False Signals: If two or more trades near a level result in false signals, subsequent signals from that level should be ignored.
- Flat Markets: In flat conditions, pairs may generate many false signals or none at all. It's better to stop trading at the first signs of a flat market.
- Trading Hours: Open trades between the start of the European session and the middle of the US session, then manually close all trades.
- MACD Signals: On the hourly timeframe, trade MACD signals only during periods of good volatility and a clear trend confirmed by trendlines or trend channels.
- Close Levels: If two levels are too close (5–20 pips apart), treat them as a support or resistance zone.
- Stop Loss: Set a Stop Loss to breakeven after the price moves 20 pips in the desired direction.
Key Chart Elements:
Support and Resistance Levels: These are target levels for opening or closing positions and can also serve as points for placing Take Profit orders.
Red Lines: Channels or trendlines indicating the current trend and the preferred direction for trading.
MACD Indicator (14,22,3): A histogram and signal line used as a supplementary source of trading signals.
Important Events and Reports: Found in the economic calendar, these can heavily influence price movements. Exercise caution or exit the market during their release to avoid sharp reversals.
Forex trading beginners should remember that not every trade will be profitable. Developing a clear strategy and practicing proper money management are essential for long-term trading success.