The EUR/USD currency pair experienced a slight retracement from last week's highs on Monday. It's important to note that the euro's significant upward movement last week was neither logical nor justified from a local macroeconomic or fundamental perspective. Most reports and events from last week supported the dollar, while those that favored the euro were too weak and unconvincing to justify a rally of 200 pips. Consequently, the move was primarily technical in nature.
On the daily time frame, the upward correction continues, but it is only superficially bullish and largely driven by expectations. Even on the four-hour time frame, it is clear that the pair is moving sideways rather than upward. This trend is not surprising; although the euro gained strength last week, the rise lacked real justification. In other words, there is no fundamental basis for the euro's growth, not even at a local level. Even when the market is due for a correction, it struggles to find reasons to buy the euro.
Thus, the main factor to keep in mind is the ongoing correction on the daily time frame. Since the euro is rising with difficulty, this correction could last several more weeks or months. The pair will likely continue fluctuating between upward movements and pullbacks. From January lows, the pair may ultimately retrace 400 to 500 pips, but this could take a long time. A correction is not only about profit-taking on previously opened positions but also about the market reassessing the currency pair's trajectory.
On Monday, nothing of interest happened in the Eurozone or the U.S. Even Donald Trump was relatively silent. The third week of each month tends to be one of the dullest, meaning there will be very few significant events in the next four trading days. As a result, the euro may continue moving north, but traders should remember that this is merely a correction with no macroeconomic basis for such a move.
If you are trading intraday, you can open positions in either direction. However, it's important to remember that corrections are often complex and involve frequent pullbacks in the opposite direction. Trading within a clear trend is generally easier. Currently, there is no discernible trend, even on the hourly time frame.
For medium-term trading, there is no strong reason to go long at this moment. Given the current global macroeconomic environment, the most likely scenario is further downside within the ongoing four-month downtrend, as well as the broader 16-year bearish trend. While these trends will eventually come to an end, a fundamental reversal requires strong catalysts, clear signals, and confirmations.
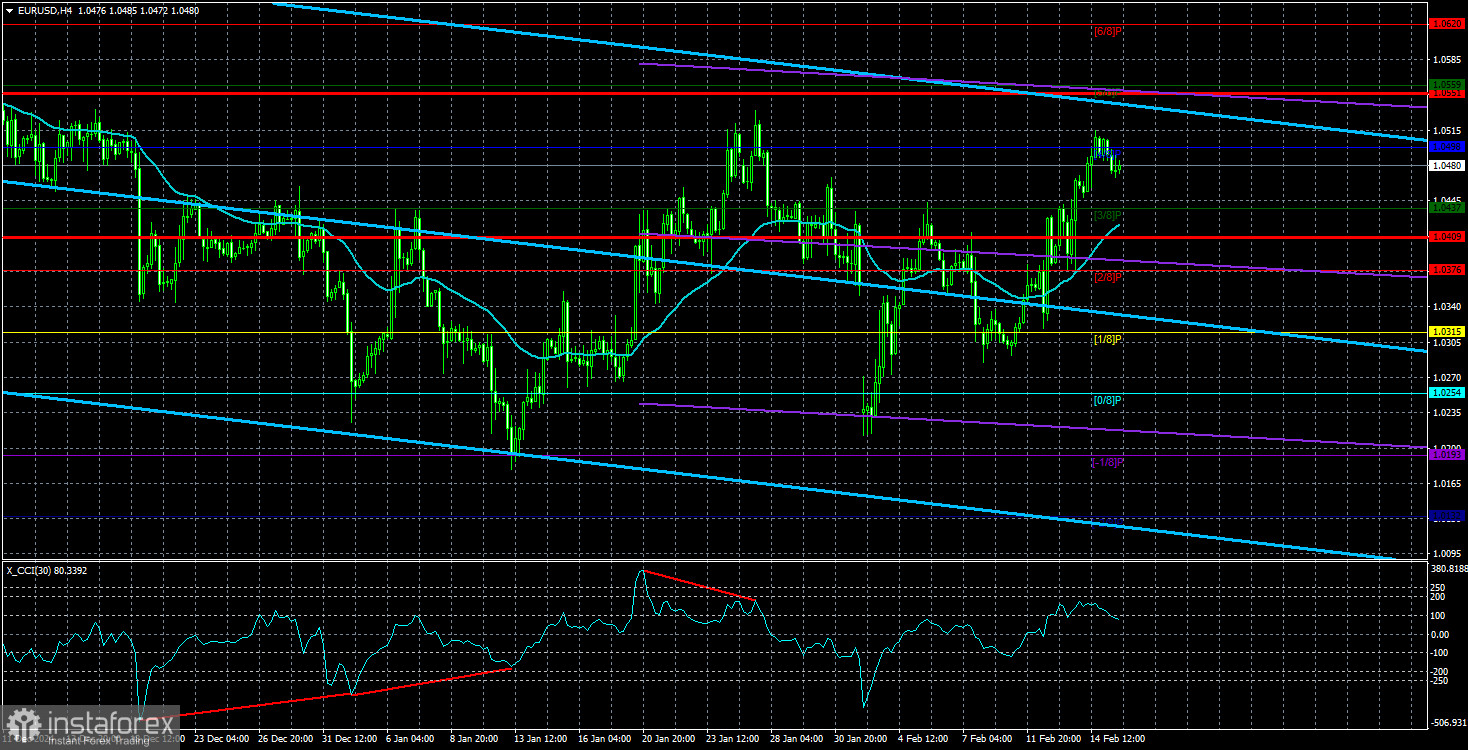
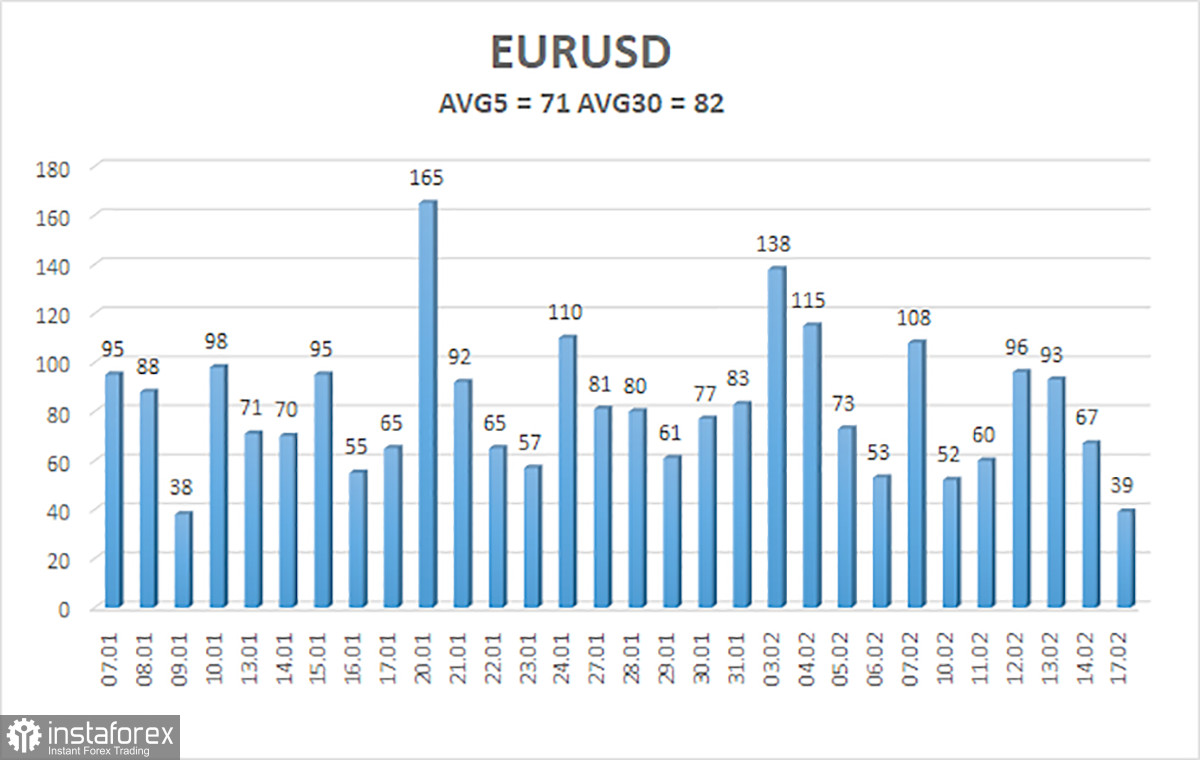
The EUR/USD pair's average volatility over the last five trading days, as of February 18, is 71 pips, which is classified as "average." We expect the pair to trade between 1.0409 and 1.0551 on Tuesday. The long-term regression channel remains downward, maintaining the global bearish trend. The CCI indicator entered the oversold zone and has since started a new recovery from the lows.
Nearest Support Levels:
S1 – 1.0437
S2 – 1.0376
S3 – 1.0315
Nearest Resistance Levels:
R1 – 1.0498
R2 – 1.0559
R3 – 1.0620
Trading Recommendations:
The EUR/USD pair continues its upward correction. For months, we have consistently stated that we expect the euro to decline in the medium term, and nothing has changed in this regard. The Federal Reserve has paused its monetary easing while the European Central Bank is accelerating it. The dollar still has no fundamental reasons for a medium-term decline except for purely technical, corrective factors. Short positions remain far more attractive, but this technical correction could persist for some time. If you trade using a purely technical approach, long positions can be considered if the price remains above the moving average, with targets at 1.0551 and 1.0559. However, any growth should still be viewed as a correction in the daily time frame.
Explanation of Illustrations:
Linear Regression Channels help determine the current trend. If both channels are aligned, it indicates a strong trend.
Moving Average Line (settings: 20,0, smoothed) defines the short-term trend and guides the trading direction.
Murray Levels act as target levels for movements and corrections.
Volatility Levels (red lines) represent the likely price range for the pair over the next 24 hours based on current volatility readings.
CCI Indicator: If it enters the oversold region (below -250) or overbought region (above +250), it signals an impending trend reversal in the opposite direction.