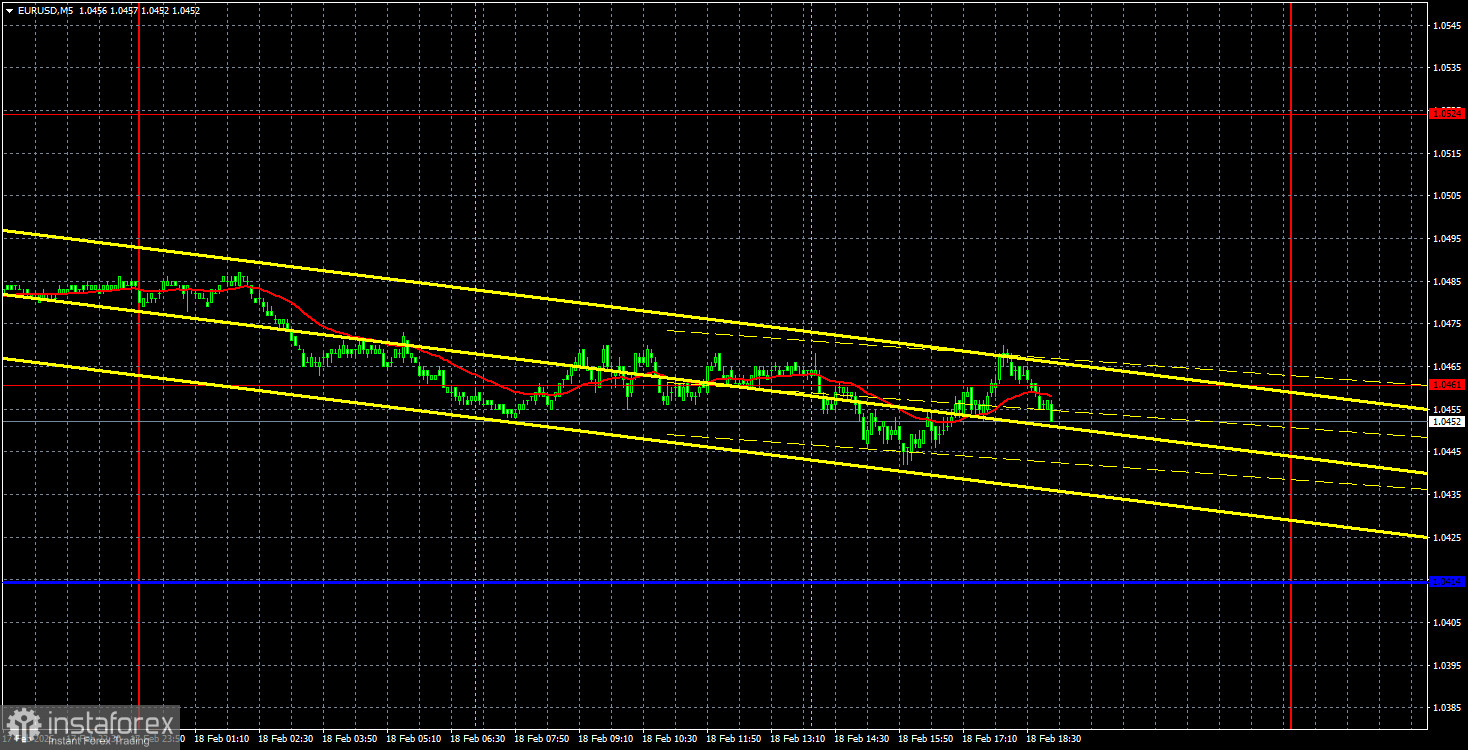
EUR/USD 5-Minute Analysis
On Tuesday, the EUR/USD currency pair displayed little willingness to engage in trading, as intraday volatility remained minimal and there was effectively no significant movement. For the second consecutive day, the euro continued to decline gradually toward the critical Kijun-sen line, which can be viewed as a local correction, as we had cautioned on Monday. The uptrend remains intact, supported by the trendline; however, market activity has significantly diminished.
With very few important events scheduled for this week, we may continue to see similar trading patterns for the next three days. It's important to remember that the recent upward movement is merely a correction on the daily timeframe, while the pair's decline on Monday and Tuesday represents a local correction within this broader context. Attempting to trade within one correction that is nested inside another correction may not yield optimal results.
On Tuesday, the macroeconomic backdrop was virtually non-existent, with only two minor economic sentiment indices from the ZEW Institute being released. These indices did not influence the market, despite their relatively high values. Currently, traders are more focused on other factors such as the global correction, the monetary policies of the Federal Reserve and the European Central Bank, as well as Donald Trump's stance on foreign policy.
Throughout the day on the 5-minute timeframe, the price frequently fluctuated around the 1.0461 level in both directions. Given the low volatility, entering the market was not advisable. By the European trading session, it was clear that the price was disregarding the 1.0461 level and trading directly along it. The situation did not improve during the American session either.
COT Report
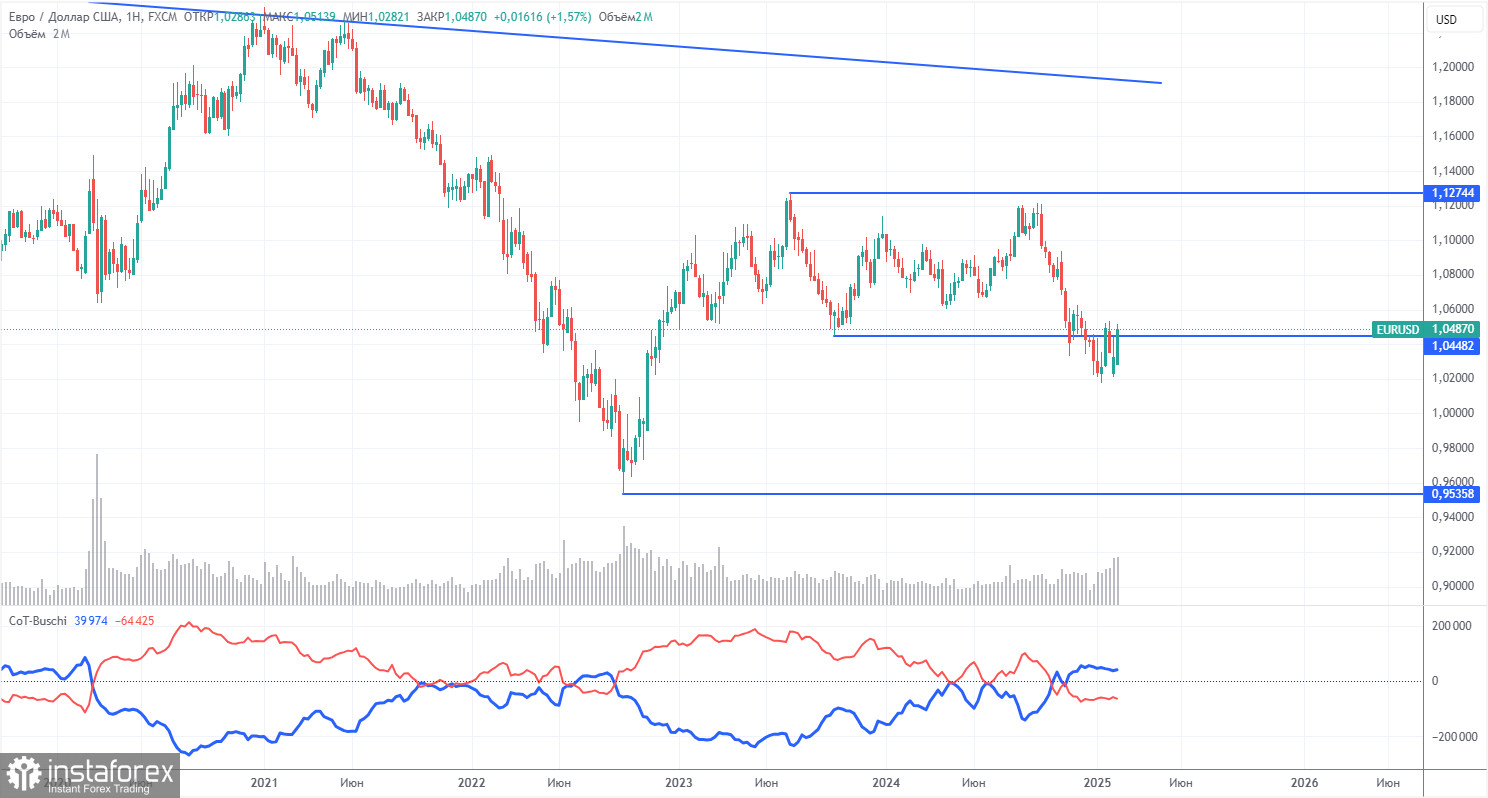
The latest Commitments of Traders (COT) report, dated February 11, reveals that non-commercial traders have maintained a bullish net position for an extended period. However, bears have now taken control. Three months ago, there was a significant increase in short positions among professional traders, resulting in a negative net position for the first time in a long while. This shift indicates that the euro is now being sold more frequently than it is being bought.
Currently, there are no fundamental factors supporting the strength of the euro. The recent upward movement on the weekly timeframe is barely noticeable, suggesting it is merely a technical pullback. The long-standing 16-year downward trend remains intact, even if the pair continues to experience corrections for a few more weeks.
At present, the red and blue lines in the COT report have crossed, indicating a change in their relative positions and signaling a bearish trend in the market. During the last reporting week, long positions among non-commercial traders increased by 3,000, while short positions rose by 8,800, leading to a net position decrease of 5,800.
EUR/USD 1-Hour Analysis
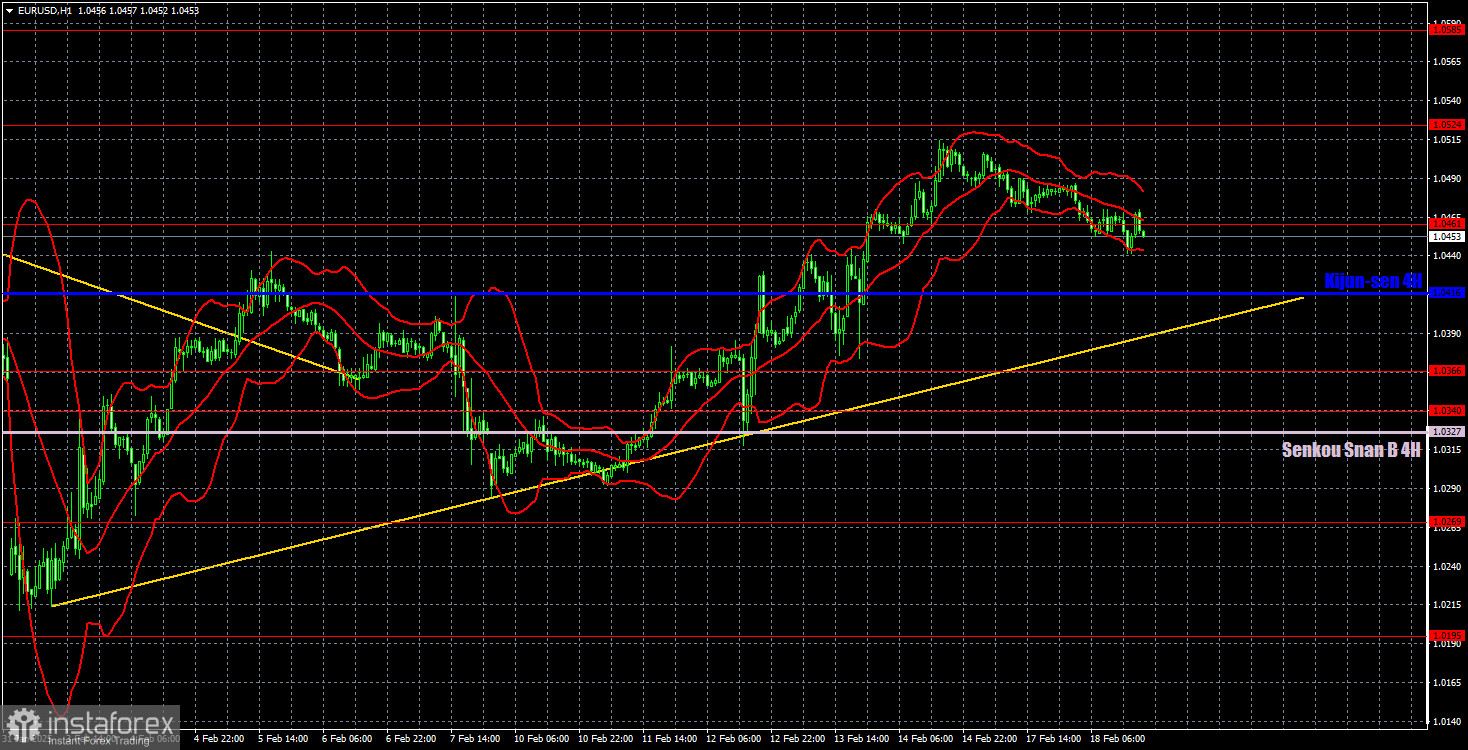
On the hourly timeframe, the currency pair continues its local uptrend. However, we anticipate a decline in the medium term, as the Fed may cut rates only 1-2 times in 2025, while the ECB is expected to implement significantly more cuts. In the short term, we might experience one or two additional upward movements, as the correction on the daily timeframe is likely to take a while to complete. Currently, there are no strong fundamental reasons for the euro to rise; its present growth is approximately 80% technical.
For February 19, we identify the following key trading levels: 1.0124, 1.0195, 1.0269, 1.0340-1.0366, 1.0461, 1.0524, 1.0585, 1.0658-1.0669, 1.0757, 1.0797, and 1.0843. Additionally, we note the Senkou Span B line at 1.0327 and the Kijun-sen at 1.0416. Please be aware that the Ichimoku indicator lines may shift throughout the day, which should be considered when identifying trading signals. Also, remember to place a Stop Loss at breakeven if the price moves 15 pips in your favor to protect against potential losses in case a signal turns out to be false.
For Wednesday, there are no significant economic events scheduled in the Eurozone. In the United States, reports on building permits and housing starts will be released, along with the minutes of the latest Federal Reserve meeting. However, we consider these events of secondary importance, unlikely to trigger significant market movement. Overall, it appears that we may experience a third consecutive day of ultra-low market volatility.
Illustration Explanations:
- Support and Resistance Levels (thick red lines): Thick red lines indicate where movement may come to an end. Please note that these lines are not sources of trading signals.
- Kijun-sen and Senkou Span B Lines: Ichimoku indicator lines transferred from the 4-hour timeframe to the hourly timeframe. These are strong lines.
- Extreme Levels (thin red lines): Thin red lines where the price has previously bounced. These serve as sources of trading signals.
- Yellow Lines: Trendlines, trend channels, or any other technical patterns.
- Indicator 1 on COT Charts: Represents the net position size for each category of traders.