GBP/USD 5-Minute Analysis
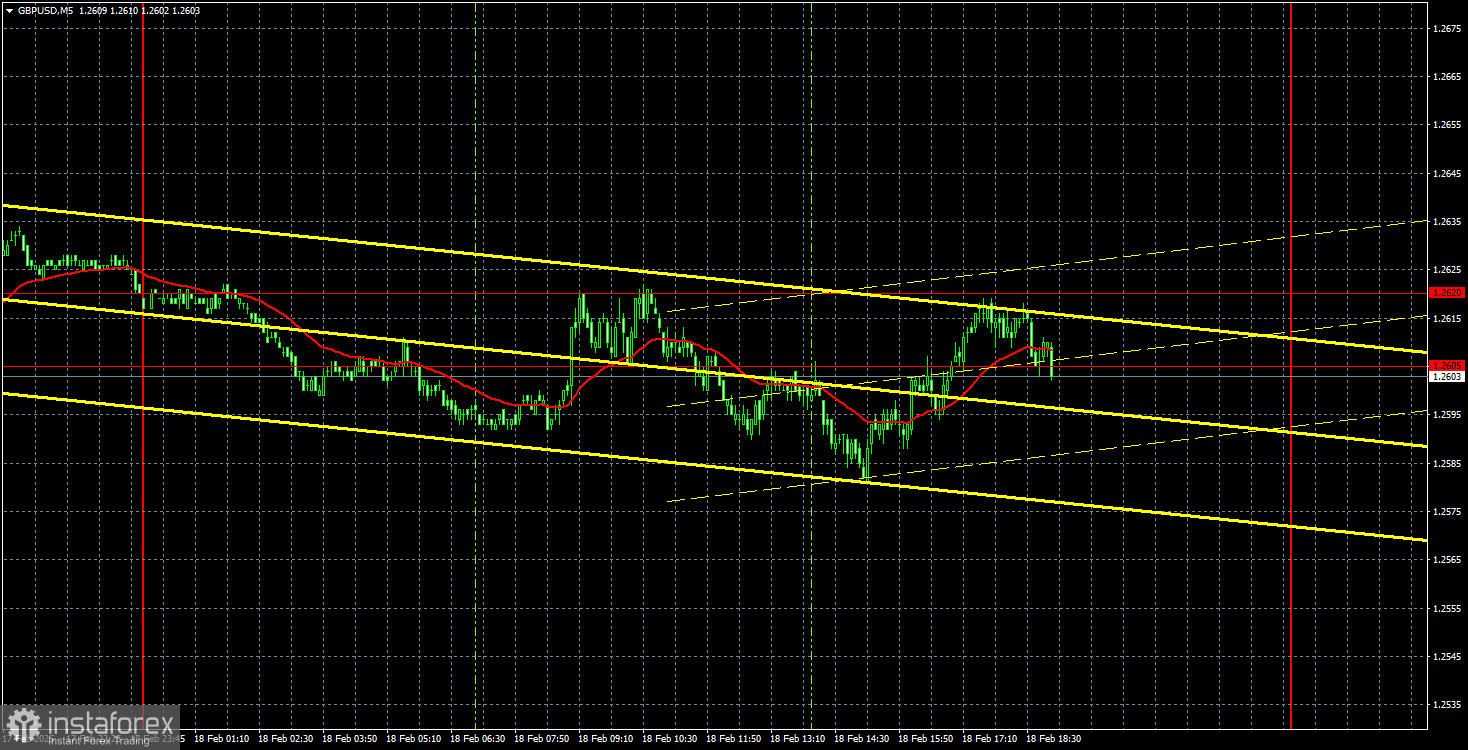
On Tuesday, the GBP/USD currency pair mirrored the behavior of its more dominant counterpart. For the second consecutive day, we observed a completely sideways movement. On Monday, the price attempted to break above the 1.2605-1.2620 range, but the bulls are not able to sustain an upward push indefinitely without solid reasoning. Last week, 70% of the British currency's growth was not backed by any macroeconomic or fundamental events.
Yesterday, the UK released several significant reports regarding unemployment and wages, which could be considered "conditionally strong." However, these reports did not prompt any substantial market reaction. The pound has once again exceeded expectations for growth. The upward correction on the daily timeframe may persist for several more weeks, and we could still see additional local trends on the hourly timeframe.
The UK unemployment rate remained steady at 4.4%, while wages increased by 6%. Both of these reports are positive for the British currency, but they are not strong enough to support a prolonged and significant uptrend. While the pound may have appreciated locally yesterday, the overall fundamental picture remains unchanged.
There were no noteworthy trading signals on Tuesday. Formally, the price bounced twice from the 1.2605-1.2620 range, and short positions could have been initiated from this level. However, due to the low volatility and the sideways movement, it may take several days to witness any meaningful decline.
COT Report
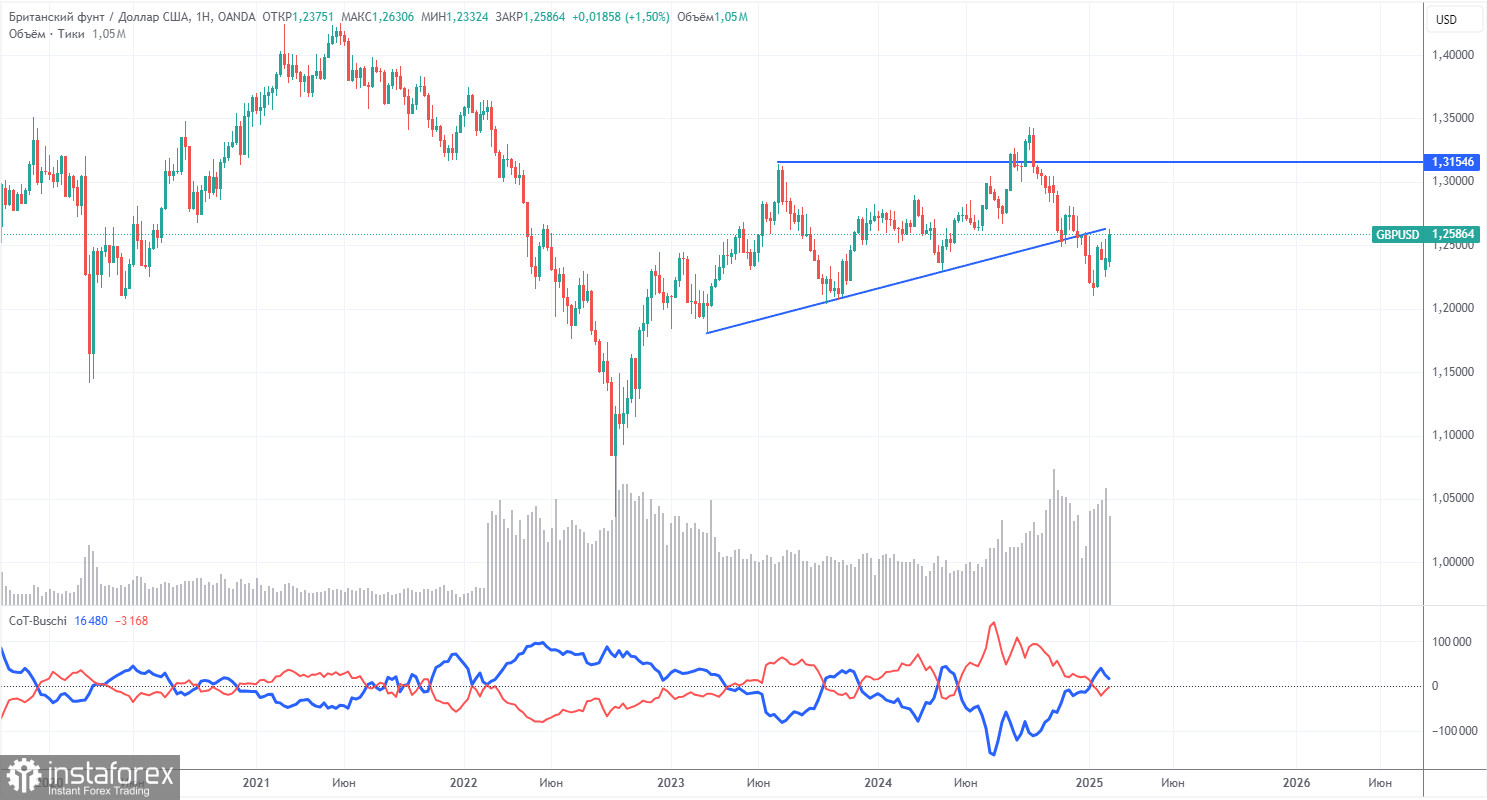
The Commitments of Traders (COT) reports for the British pound indicate that sentiment among commercial traders has been consistently shifting over the past few years. The red and blue lines, which represent the net positions of commercial and non-commercial traders, frequently intersect and generally remain close to the zero level. Currently, these lines are near each other, suggesting that the number of buy and sell positions is almost equal.
On the weekly timeframe, the price initially broke through the 1.3154 level before dropping to the trendline, which it subsequently breached. This break of the trendline strongly suggests that the pound's decline is likely to continue. However, there was also a rebound from the previous local low on the weekly timeframe, indicating that the currency pair may be experiencing a flat.
According to the latest COT report, the Non-commercial group opened 3,600 buy contracts and closed 4,500 sell contracts, resulting in an increase of 8,100 in net positions. However, this shift does not provide any substantial support for the pound.
The fundamental backdrop still does not justify long-term purchases of the pound, and the currency has a real chance of continuing its global downtrend. As such, net positions may continue to decline, signaling a potential further drop in demand for the British pound.
GBP/USD 1-Hour Analysis
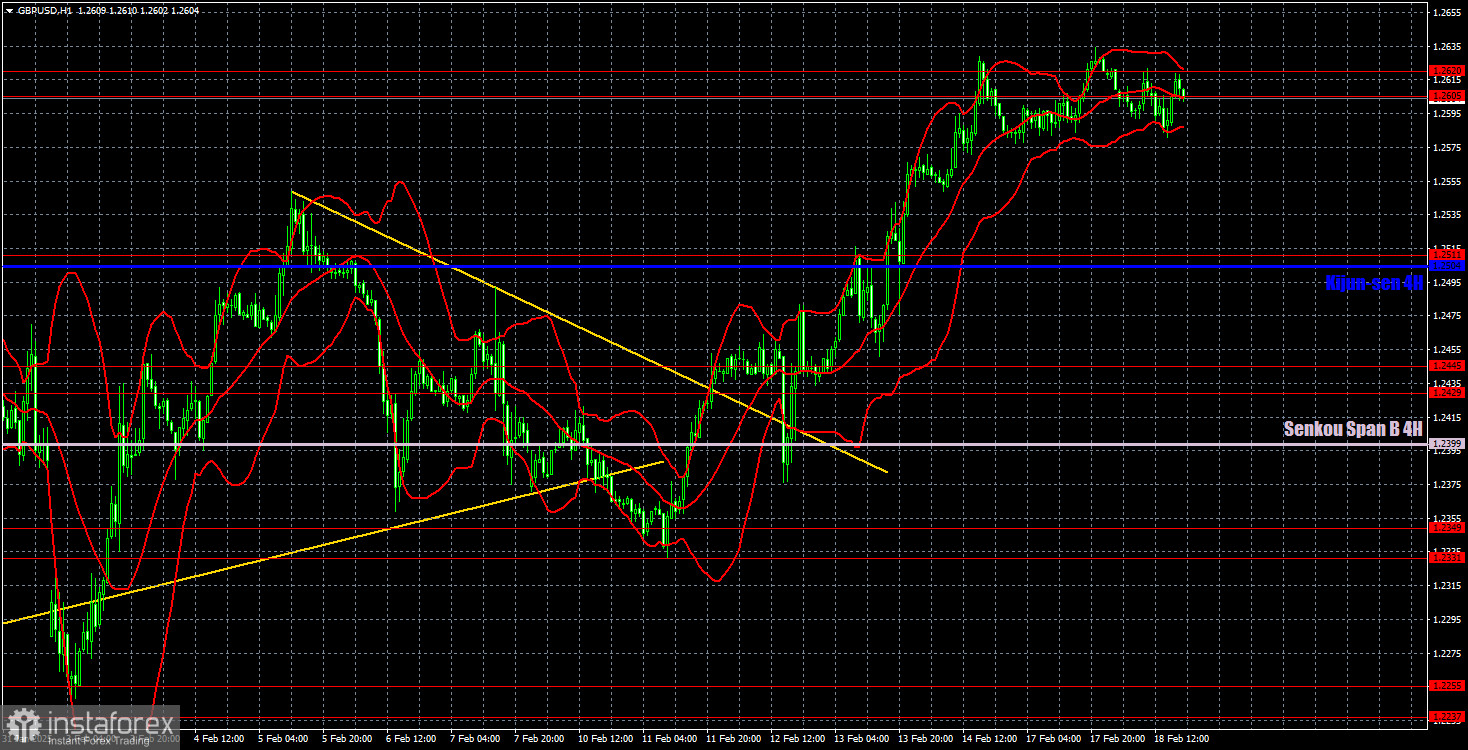
On the hourly timeframe, the GBP/USD pair is maintaining a steady uptrend. However, this may not signify the final trend shift in the current cycle. There are no fundamental reasons supporting a long-term rise for the pound. Across higher timeframes and from a broader perspective, opening long positions is not advisable. The pound's current growth appears to be primarily technical and corrective on the daily timeframe.
For February 19, we highlight the following key trading levels: 1.2052, 1.2109, 1.2237-1.2255, 1.2331-1.2349, 1.2429-1.2445, 1.2511, 1.2605-1.2620, 1.2691-1.2701, and 1.2796-1.2816. The Senkou Span B line at 1.2399 and the Kijun-sen at 1.2504 may also act as significant signal levels. It is advisable to set a Stop Loss at breakeven if the price moves in your favor by 20 pips, as this will help protect against potential losses if a signal is false. Keep in mind that the Ichimoku indicator lines may fluctuate throughout the day, so they should be considered dynamically when identifying trading signals.
On Wednesday, the UK will release its inflation report, which is a key economic indicator that could energize the market. The forecast for January indicates an acceleration to 2.8% year-over-year. If the actual data is lower than expected, the pound may begin the anticipated decline from the 1.2605-1.2620 range. It's important to note that U.S. reports and the Federal Reserve minutes are unlikely to significantly impact the pair's movement throughout the day.
Illustration Explanations:
- Support and Resistance Levels (thick red lines): Thick red lines indicate where movement may come to an end. Please note that these lines are not sources of trading signals.
- Kijun-sen and Senkou Span B Lines: Ichimoku indicator lines transferred from the 4-hour timeframe to the hourly timeframe. These are strong lines.
- Extreme Levels (thin red lines): Thin red lines where the price has previously bounced. These serve as sources of trading signals.
- Yellow Lines: Trendlines, trend channels, or any other technical patterns.
- Indicator 1 on COT Charts: Represents the net position size for each category of traders.