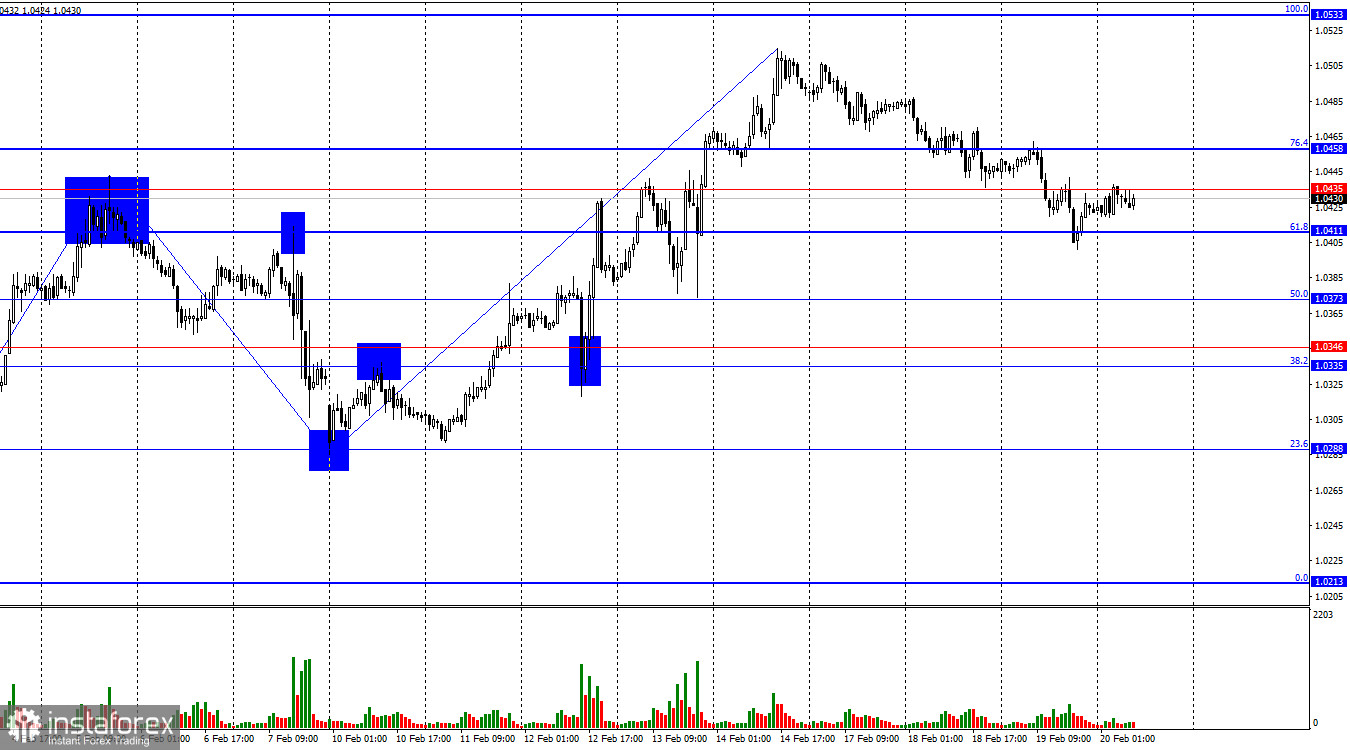
On Wednesday, EUR/USD continued its downward movement, reaching the 61.8% Fibonacci retracement level at 1.0411. A rebound from this level would favor the euro's recovery towards 1.0458 and 1.0533. Conversely, a break below 1.0411 would increase the likelihood of further declines toward 1.0373 and 1.0346.
The wave structure on the hourly chart has become increasingly unclear. The latest completed downward wave did not break below the previous low, while the latest upward wave exceeded the previous peak. This suggests that the trend has shifted back to a bullish phase or that the pair is experiencing a complex sideways movement, which is more evident on the 4-hour chart. The size disparity among recent waves adds to the uncertainty about the current trend.
On Wednesday, the economic data had little impact on market participants. The U.S. housing and construction reports were ignored, and the FOMC meeting minutes contained no surprises. However, two key points from the FOMC statement are worth noting:
- FOMC officials are concerned about Donald Trump's trade policies, particularly import tariffs. The Federal Reserve fears that Trump's actions could slow inflation progress, with analysts estimating that tariffs could push U.S. inflation up by 0.5% to 1.0%.
- U.S. inflation is rising even without Trump's tariffs. The latest CPI data shows inflation has already climbed to 3%, and tariffs on China, which have only been in place for two weeks, could not have influenced the last four months of inflation data. If inflation rises by another 0.5%, the Fed may shift its focus from rate cuts to potential tightening instead.
Given these factors, the FOMC is likely to remain cautious about rate cuts in 2025, which could support the dollar and favor bearish traders in the long term.
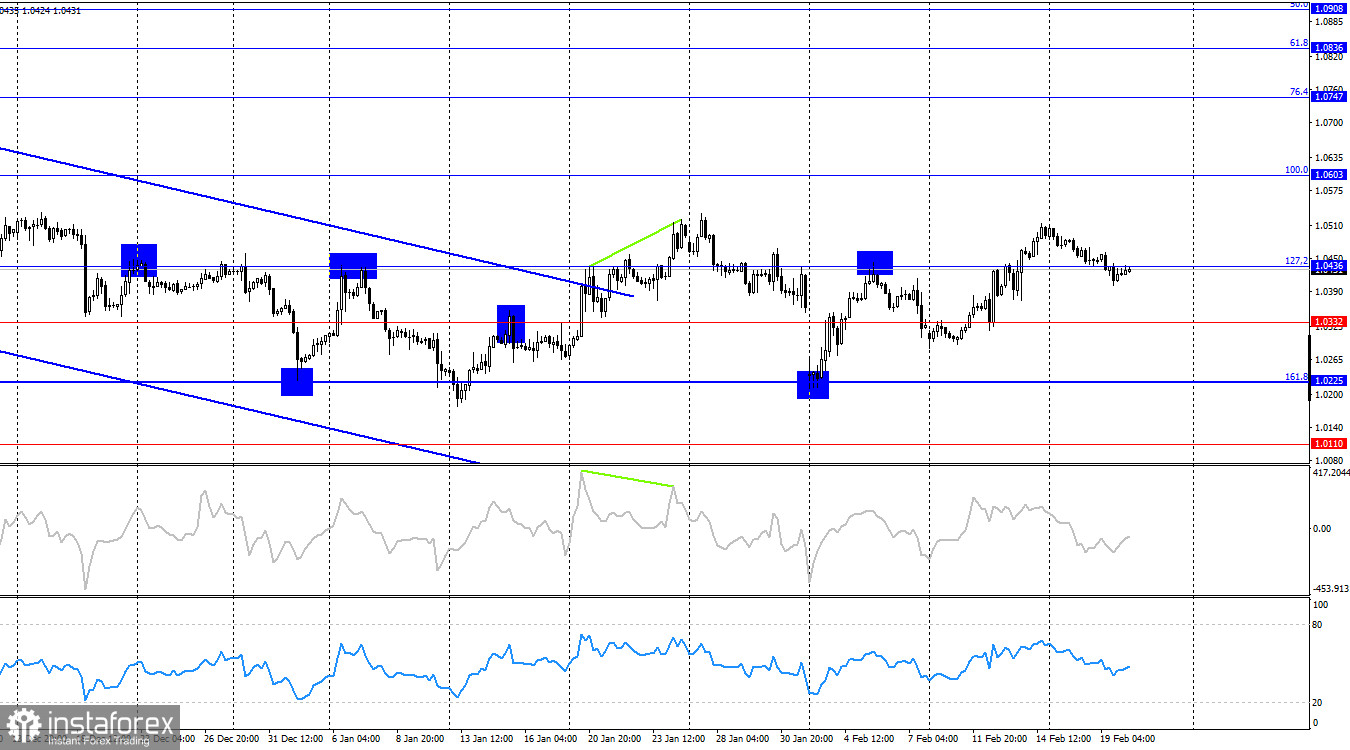
On the 4-hour chart, the EUR/USD retraced to the 127.2% Fibonacci level at 1.0436 and consolidated above it. However, the overall market structure in 2025 remains predominantly sideways, signaling range-bound movement rather than a clear trend. This suggests that a renewed decline towards the 161.8% Fibonacci retracement level at 1.0225 is possible.
There are currently no signs of divergences in any technical indicators, indicating that the downtrend may persist.
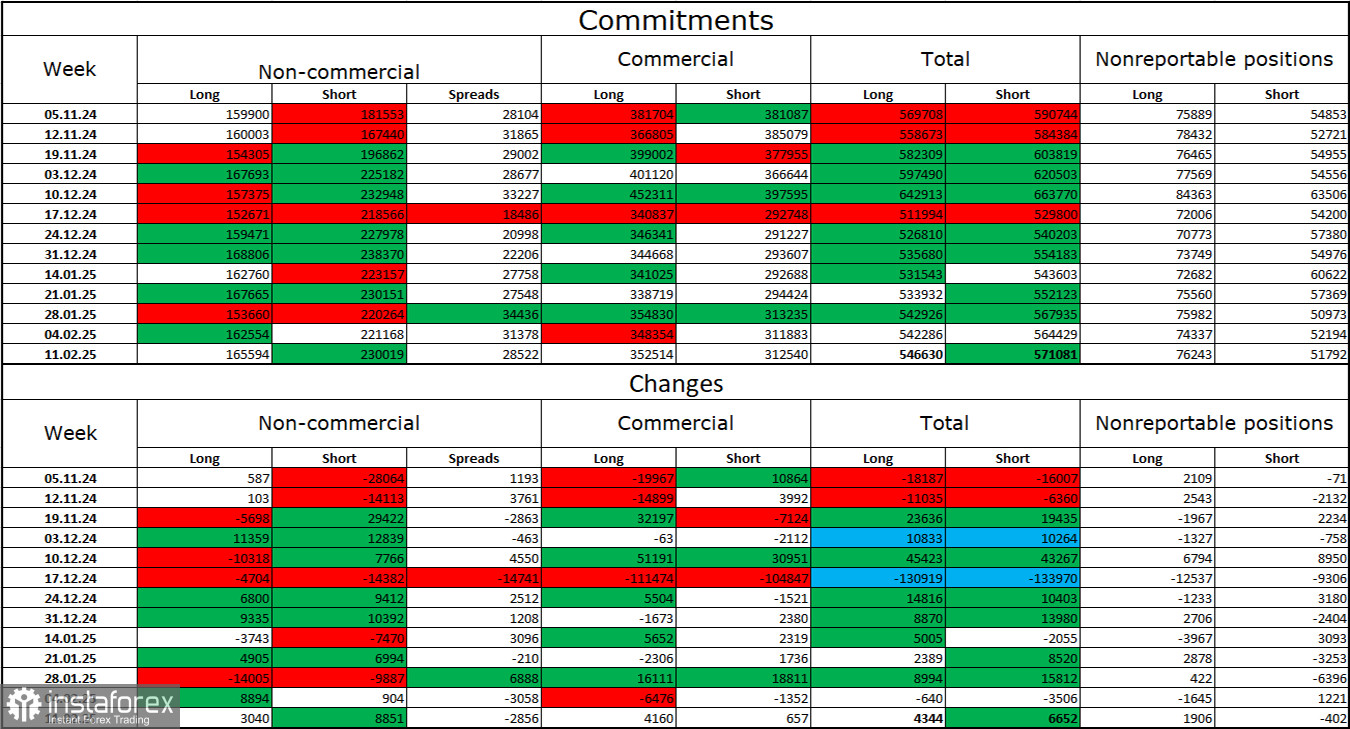
Commitments of Traders (COT) Report
Over the last reporting week, institutional traders opened 3,040 long positions and 8,851 short positions, reinforcing a bearish sentiment for EUR/USD. The total number of long positions among speculative traders now stands at 165,000, while short positions have grown to 230,000.
For 21 consecutive weeks, large investors have reduced euro holdings, maintaining a clear bearish trend. Occasionally, bulls dominate individual weeks, but these moments are exceptions rather than a trend reversal.
The main driver of the dollar's decline—expectations of FOMC rate cuts—has already been priced in. There is no immediate reason to sell the dollar further, although new catalysts could emerge over time. However, for now, the likelihood of further gains in the U.S. dollar remains higher. Technical analysis also suggests that the long-term bearish trend is intact, reinforcing expectations of continued EUR/USD declines.
Key Economic Events for the U.S. and the Eurozone:
- U.S. – Initial Jobless Claims (13:30 UTC)
- U.S. – Philadelphia Fed Manufacturing Index (13:30 UTC)
The February 20 economic calendar contains two minor events, both of which are unlikely to impact market sentiment significantly. Given that traders already ignored more crucial data earlier in the week, the influence of fundamentals on Thursday is expected to be minimal.
EUR/USD Forecast & Trading Recommendations
Yesterday's short positions were justified at the 1.0458 level, with targets at 1.0435 and 1.0411, both of which were successfully reached.
New selling opportunities may emerge on rebounds from key resistance levels or a confirmed breakdown below 1.0411, with a downside target of 1.0373.
Buying opportunities are possible if EUR/USD rebounds from 1.0411, though the pair is likely stuck in a sideways range on the 4-hour chart, where selling pressure remains stronger.
The Fibonacci retracement levels are set at 1.0533–1.0213 on the hourly chart and 1.0603–1.1214 on the 4-hour chart.