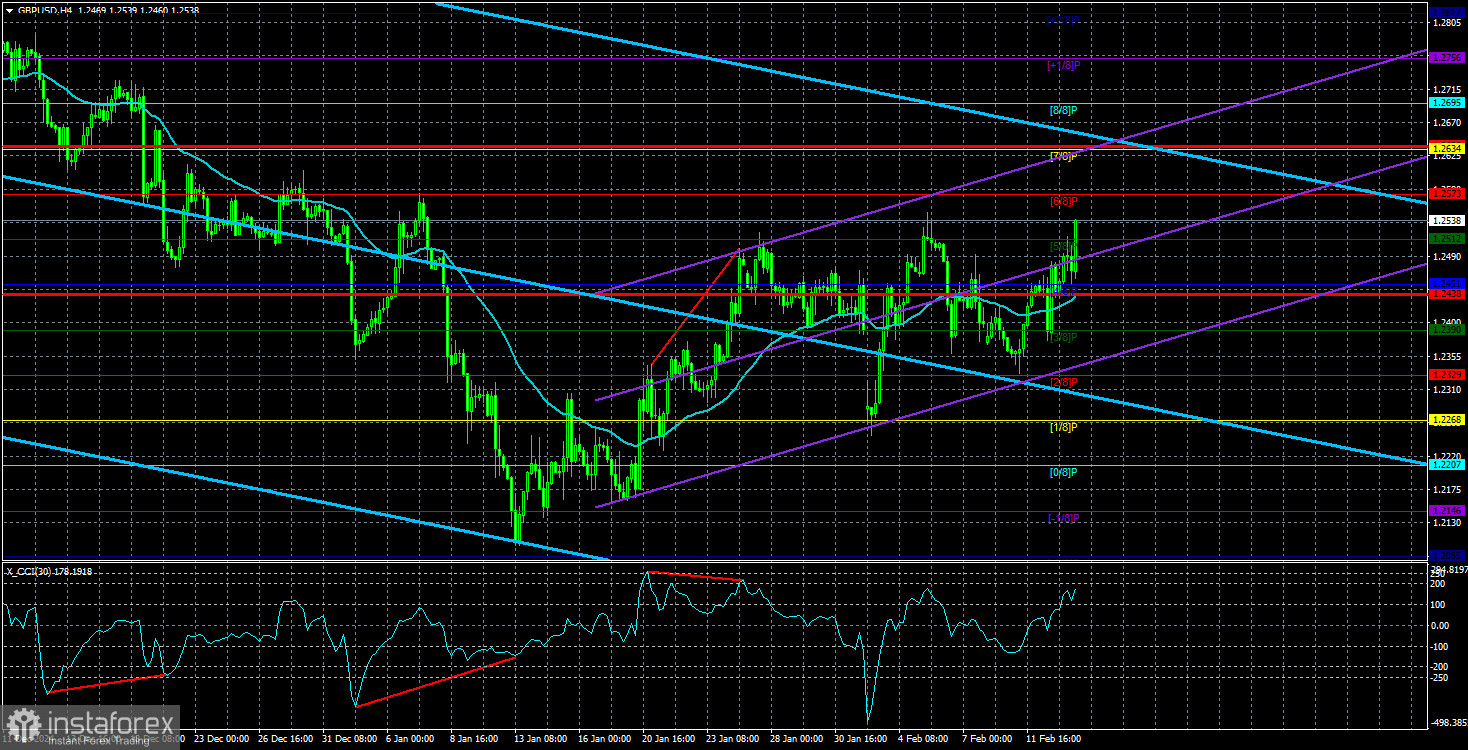
On Thursday, the GBP/USD currency pair tested the Murray level "5/8" at 1.2512 for the third time in recent days. Another rebound from this level led to a further decline in the pair. It's important to note that just a day earlier, the British pound had experienced a significant increase, although the only major driver for that movement was the U.S. inflation report, which favored the dollar. The illogical price movements seen on Wednesday continued into Thursday.
For once, UK macroeconomic data provided some positive surprises. However, both reports still suggested overall weakness. Having learned from past disappointments, market experts have adjusted their expectations downwards regarding UK economic indicators. The fourth-quarter UK GDP was initially projected to decrease by 0.1% quarter-on-quarter, but the actual figure showed a slight increase of 0.1%. Can such a marginal rise truly be classified as "growth"? Clearly, the UK economy has remained stagnant, and this minimal increase does not signal any significant improvement. Nevertheless, since expectations were exceeded, the British pound had some room for upward movement on Thursday.
The same applies to the industrial production report for December. Analysts had anticipated a 0.2% month-on-month increase, yet the actual figure reached 0.5%. Again, it's challenging to discuss growth in the UK industrial sector, especially considering that year-over-year industrial production declined by 1.9%. However, from a formal standpoint, this report was also considered a positive development for the pound. Despite this, following the data releases, the British currency fell more than it gained.
As a result, we continue to emphasize that current market movements are chaotic and often defy logical expectations. These periods occur regularly, and traders should approach them with patience. Similar to the euro, the British pound remains in a corrective phase on the daily timeframe, which could last for several more weeks or even months. During this time, we may observe price movements that show little to no correlation with macroeconomic or fundamental factors. On the daily chart, the pound has bounced off a critical line, maintaining some potential for further upward movement. However, it is evident that this growth will be challenging, erratic, and accompanied by frequent pullbacks.
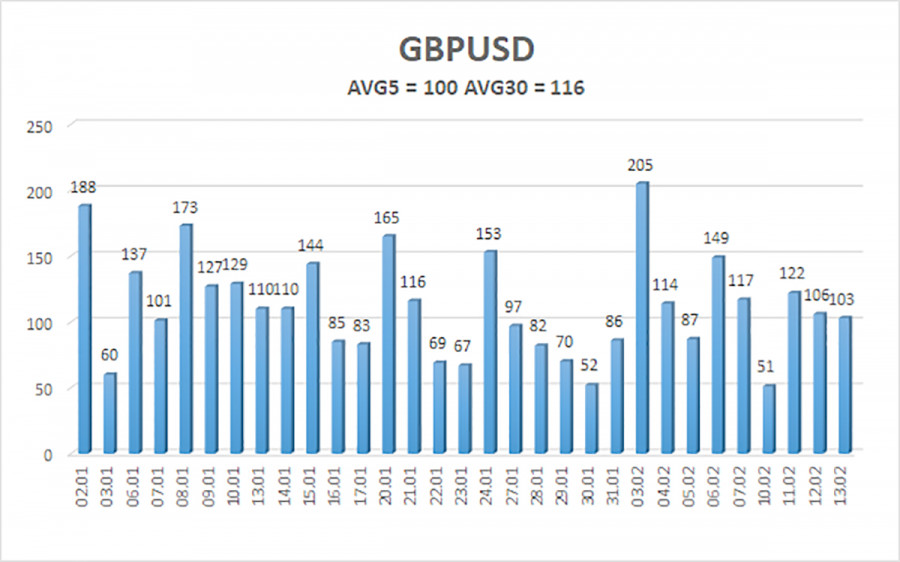
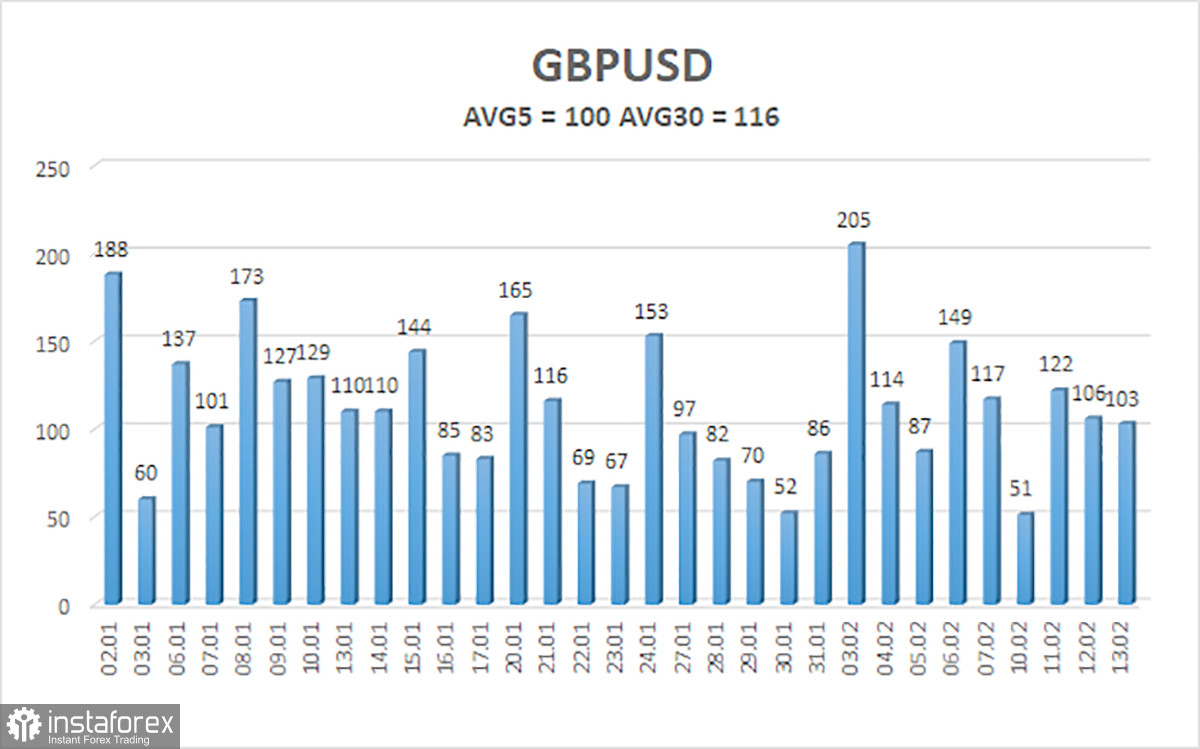
The average volatility of the GBP/USD pair over the last five trading days stands at 100 pips, considered "medium" for this currency pair. On Friday, February 14, we expect the price to move from 1.2438 to 1.2636. The higher linear regression channel remains downward-sloping, signaling an ongoing bearish trend. The CCI indicator previously entered oversold territory, suggesting the potential for a new phase of upward correction.
Nearest Support Levels:
S1 – 1.2390
S2 – 1.2329
S3 – 1.2268
Nearest Resistance Levels:
R1 – 1.2451
R2 – 1.2512
R3 – 1.2573
Trading Recommendations:
The GBP/USD currency pair continues to follow a medium-term downward trend. We still do not consider long positions, as we believe that all bullish factors for the British pound have already been priced in multiple times and that no new growth drivers are currently present.
For traders using pure technical analysis, long positions could be considered only if the price remains above the moving average, with targets at 1.2573 and 1.2634. However, short positions remain the more relevant choice, with initial targets at 1.2207 and 1.2146, as the upward correction on the daily timeframe will eventually end. For selling opportunities, it is essential to see at least a firm breakout below the moving average before entering new short positions.
Explanation of Illustrations:
Linear Regression Channels help determine the current trend. If both channels are aligned, it indicates a strong trend.
Moving Average Line (settings: 20,0, smoothed) defines the short-term trend and guides the trading direction.
Murray Levels act as target levels for movements and corrections.
Volatility Levels (red lines) represent the likely price range for the pair over the next 24 hours based on current volatility readings.
CCI Indicator: If it enters the oversold region (below -250) or overbought region (above +250), it signals an impending trend reversal in the opposite direction.