signal strength 1 of 5
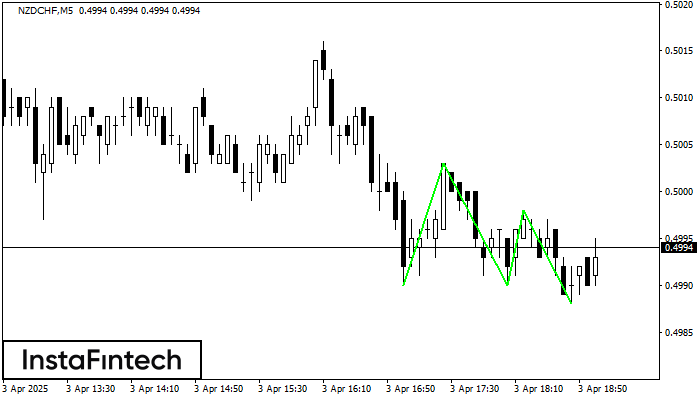
The Triple Bottom pattern has formed on the chart of NZDCHF M5. Features of the pattern: The lower line of the pattern has coordinates 0.5003 with the upper limit 0.5003/0.4998, the projection of the width is 13 points. The formation of the Triple Bottom pattern most likely indicates a change in the trend from downward to upward. This means that in the event of a breakdown of the resistance level 0.4990, the price is most likely to continue the upward movement.
The M5 and M15 time frames may have more false entry points.
- All
- Double Top
- Flag
- Head and Shoulders
- Pennant
- Rectangle
- Triangle
- Triple top
- All
- #AAPL
- #AMZN
- #Bitcoin
- #EBAY
- #FB
- #GOOG
- #INTC
- #KO
- #MA
- #MCD
- #MSFT
- #NTDOY
- #PEP
- #TSLA
- #TWTR
- AUDCAD
- AUDCHF
- AUDJPY
- AUDUSD
- EURCAD
- EURCHF
- EURGBP
- EURJPY
- EURNZD
- EURRUB
- EURUSD
- GBPAUD
- GBPCHF
- GBPJPY
- GBPUSD
- GOLD
- NZDCAD
- NZDCHF
- NZDJPY
- NZDUSD
- SILVER
- USDCAD
- USDCHF
- USDJPY
- USDRUB
- All
- M5
- M15
- M30
- H1
- D1
- All
- Buy
- Sale
- All
- 1
- 2
- 3
- 4
- 5
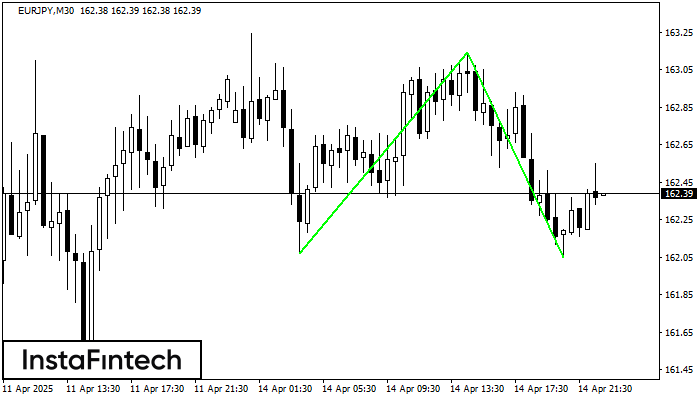
El patrón Doble Piso ha sido formado en EURJPY M30; el límite superior es 163.14; el límite inferior es 162.05. El ancho del patrón es 107 puntos. En caso
Open chart in a new window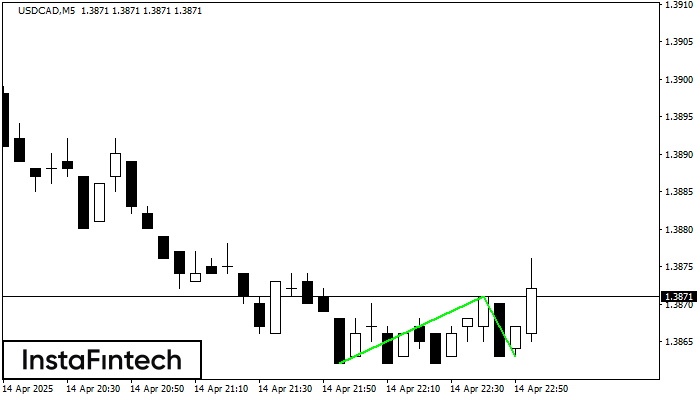
El patrón Doble Piso ha sido formado en USDCAD M5. Características: el nivel de soporte 1.3862; el nivel de resistencia 1.3871; el ancho del patrón 9 puntos. Si el nivel
Los marcos de tiempo M5 y M15 pueden tener más puntos de entrada falsos.
Open chart in a new window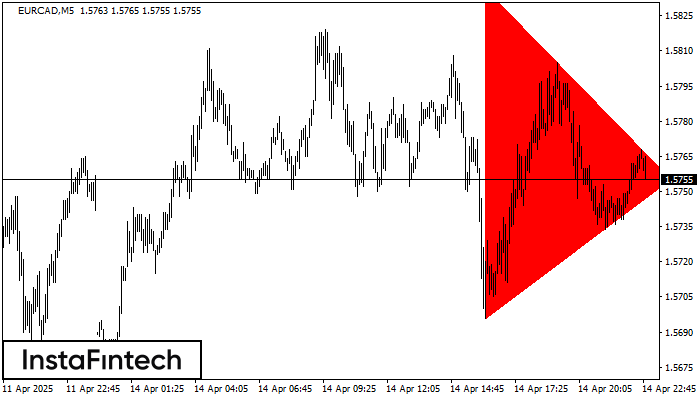
Según el gráfico de M5, el EURCAD formó el patrón Triángulo Simétrico Bajista. Este patrón señala una tendencia bajista en caso de que el límite inferior 1.5696 sea roto. Aquí
Los marcos de tiempo M5 y M15 pueden tener más puntos de entrada falsos.
Open chart in a new window