EUR/USD 5-Minute Analysis
The EUR/USD currency pair continued its upward movement on Thursday. This growth was supported by some fundamental reasons, although these factors were considerably weaker than those that contributed to the euro's decline in previous days. On Tuesday and Wednesday, Jerome Powell delivered two speeches in the U.S. Congress, where he emphasized that the Federal Reserve is in no rush to cut interest rates. The U.S. inflation report released on Wednesday further reinforced expectations that the Fed's next rate cut may not occur anytime soon, with rates likely remaining unchanged throughout 2025. Consequently, there were numerous reasons for the U.S. dollar to strengthen during those two days. Nevertheless, the euro still managed to rise.
On Thursday, the key report was industrial production in the Eurozone, which showed respectable—though not outstanding—results. Despite this, the euro continued to appreciate. This indicates that the market reacted positively to a relatively neutral report regarding the euro while overlooking data that favored the dollar. We had previously warned that the euro could continue to inch upward despite the fundamentals, as the correction on the daily timeframe is still too weak to be considered complete. Therefore, we may witness similarly illogical market movements in the coming days. An upward trendline on the hourly timeframe supports this northward movement, but it is important to note that trends on this timeframe can change very frequently.
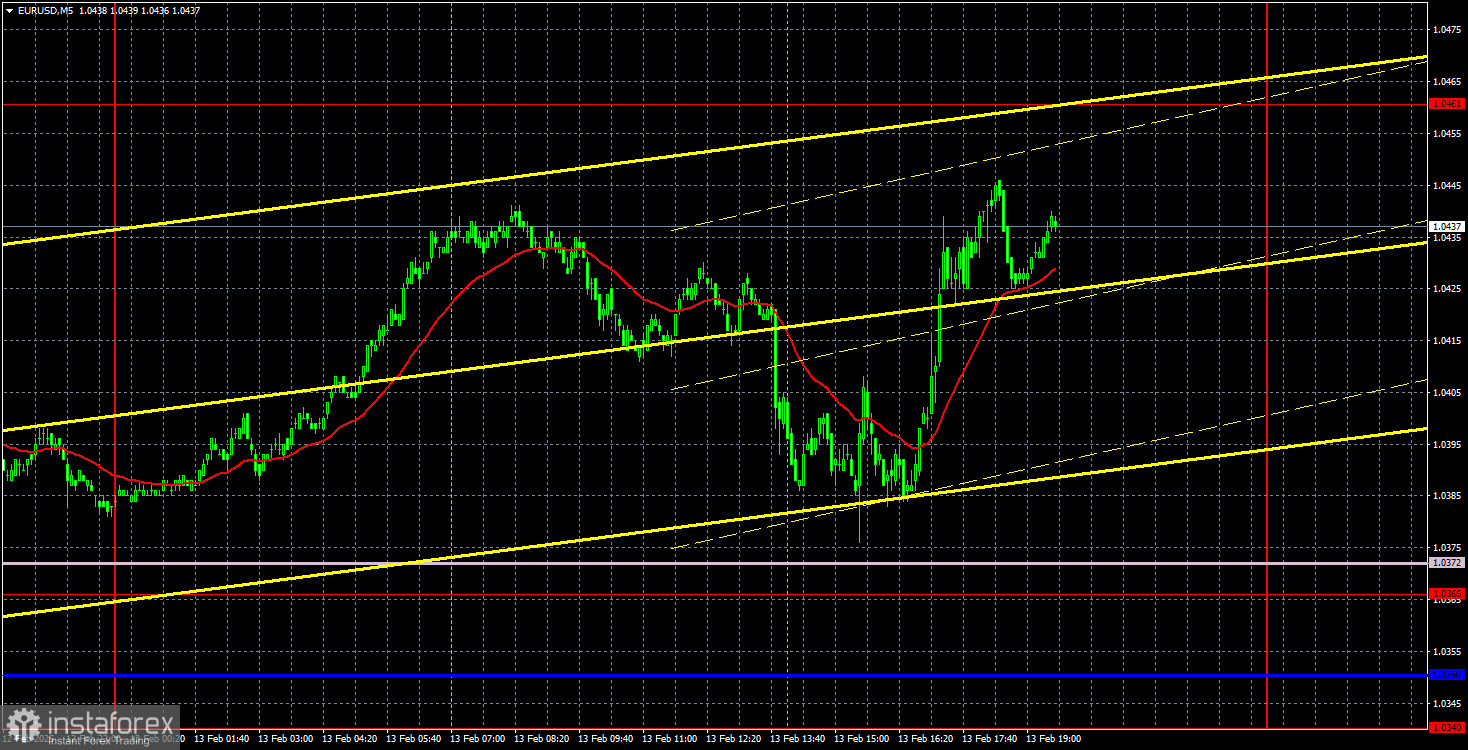
On the 5-minute timeframe, there were no trading signals on Thursday. During the U.S. session, the price approached the Senkou Span B line but fell short by just 5 pips—an unfortunate miss, as establishing a buying signal there could have led to a profitable trade.
COT Report
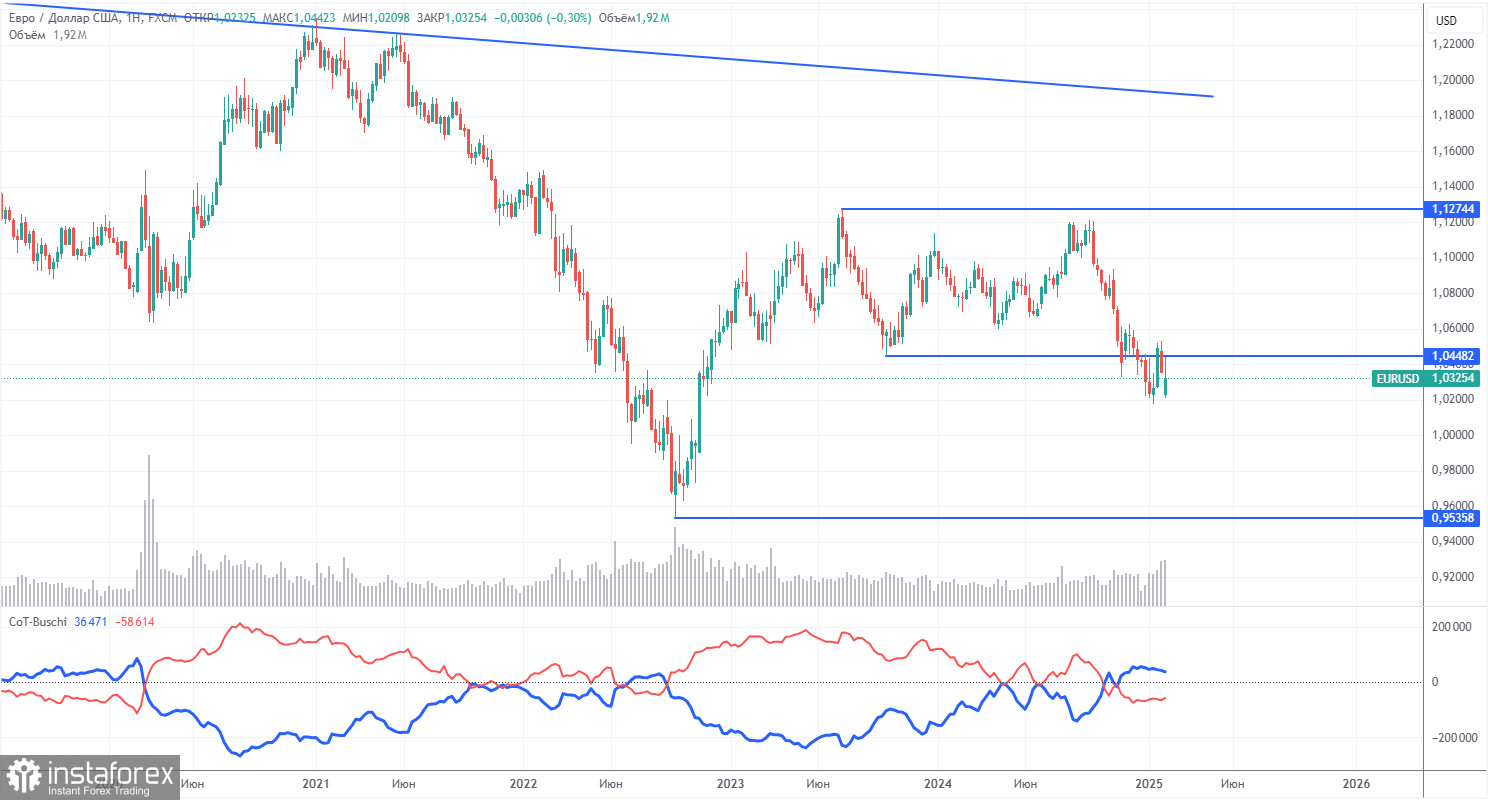
The latest Commitments of Traders (COT) report, dated February 4, confirms a shift toward bearish sentiment in the market. The accompanying chart clearly illustrates that non-commercial traders maintained a bullish net position for an extended period, but bears have now taken control. Two months ago, there was a significant increase in the number of short positions opened by institutional traders. For the first time in a long while, the net position has turned negative, indicating that the euro is now being sold more frequently than it is bought.
Currently, there are no fundamental factors that support a sustained rally in the euro. The recent bullish movement observed on the weekly timeframe is quite minimal, suggesting that it is merely a pullback. While this correction could last for several more weeks, it does not undermine the long-term 16-year downtrend.
At present, the red and blue lines have crossed and reversed their positions relative to each other, confirming a bearish trend in the market. Over the past reporting week, the number of long positions in the non-commercial category increased by 8,900, while the number of short positions rose by only 900. As a result, the net position increased by 8,000 contracts, but this change does not alter the overarching bearish trend.
EUR/USD 1-Hour Analysis
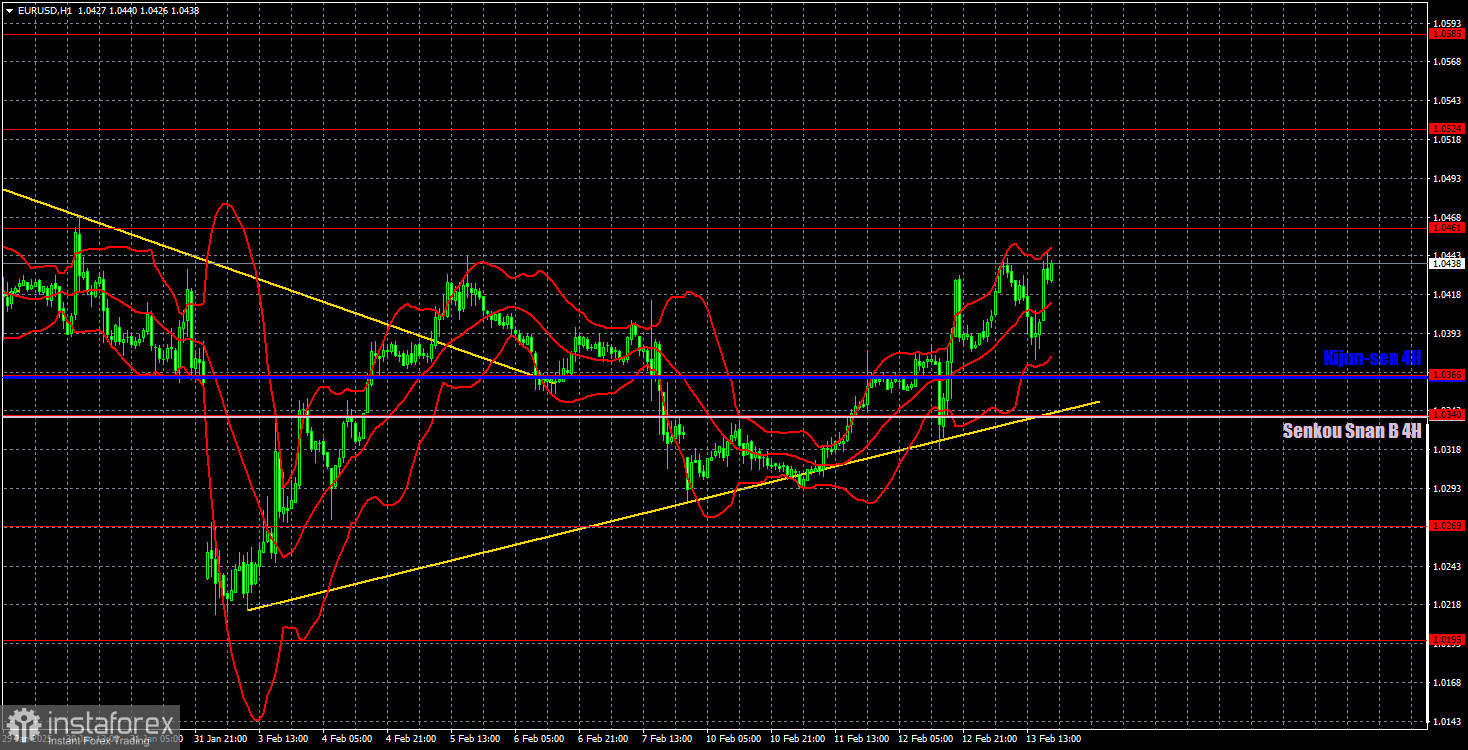
On the hourly timeframe, the currency pair has ended its local downtrend by breaking through the descending trendline and establishing a new uptrend. While we believe that a longer-term decline is probable—given that the Fed may only cut rates once or twice in 2025, which is a more hawkish stance than the market had previously anticipated—we expect to see one or two additional upward trends in the short term before a renewed decline. Fundamentally, the euro lacks strong reasons for significant appreciation, but the ongoing correction on the daily timeframe appears too weak to be considered complete.
For February 14, we highlight the following key trading levels: 1.0124, 1.0195, 1.0269, 1.0340-1.0366, 1.0461, 1.0524, 1.0585, 1.0658-1.0669, 1.0757, 1.0797, and 1.0843, along with Senkou Span B (1.0340) and Kijun-sen (1.0366). Please note that the Ichimoku indicator lines may shift throughout the day, which should be considered when identifying trading signals. Additionally, if the price moves 15 pips in the favorable direction, a Stop Loss order should be adjusted to breakeven. This measure helps protect against potential losses in the event of a false signal.
On Friday, the Eurozone will release the second estimate of Q4 GDP. However, this is not expected to be a major report, as the market is already familiar with the first estimate. In the U.S., retail sales and industrial production data will be published—these reports are relatively important, but the dollar is currently out of favor with the market.
Illustration Explanations:
- Support and Resistance Levels (thick red lines): Thick red lines indicate where movement may come to an end. Please note that these lines are not sources of trading signals.
- Kijun-sen and Senkou Span B Lines: Ichimoku indicator lines transferred from the 4-hour timeframe to the hourly timeframe. These are strong lines.
- Extreme Levels (thin red lines): Thin red lines where the price has previously bounced. These serve as sources of trading signals.
- Yellow Lines: Trendlines, trend channels, or any other technical patterns.
- Indicator 1 on COT Charts: Represents the net position size for each category of traders.