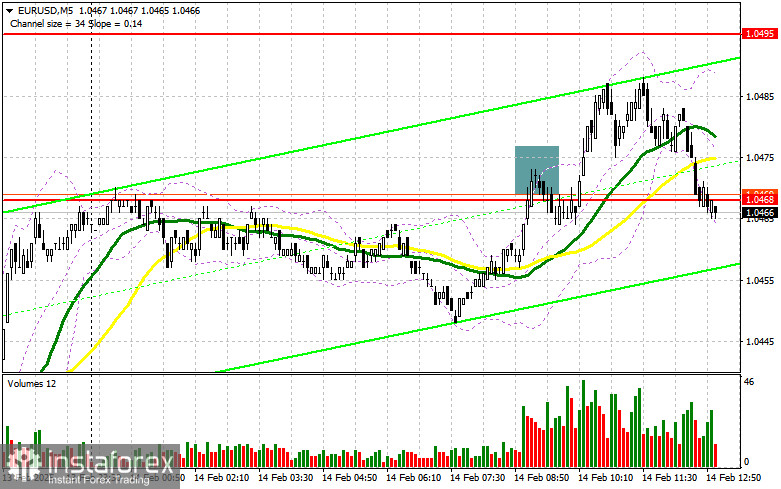
In my morning forecast, I focused on the 1.0468 level and planned to make trading decisions based on it. Let's look at the 5-minute chart and analyze what happened. A rise and the formation of a false breakout around 1.0468 provided a good entry point for short positions, but a significant drop in the pair did not materialize, leading to loss fixation. The technical outlook for the second half of the day has been revised.
To Open Long Positions on EUR/USD:
News that the eurozone GDP grew by 0.1% in Q4, slightly exceeding economists' forecasts, strengthened the euro and led to an intraday high, but a more significant rally did not follow.
In the second half of the day, we expect retail sales data from the U.S. for January, along with industrial production figures. A speech by FOMC member Lorie K. Logan later in the day will conclude the trading week. However, even strong U.S. retail sales data may not necessarily trigger dollar growth, given the current strong demand for risk assets, including the euro.
If the pair declines, I will act after a false breakout around the new support at 1.0446, which will provide a good entry point for a rise toward the resistance at 1.0489, formed in the first half of the day. A breakout and subsequent retest of this range will confirm a valid buy entry with a target at 1.0531. The furthest objective will be the 1.0567 high, where I will lock in profits.
If EUR/USD declines and shows no activity around 1.0446, buyers will lose their initiative, allowing sellers to push the price down to 1.0411. Only after a false breakout at this level will I consider buying the euro. I plan to enter long positions immediately on a rebound from 1.0376, targeting an intraday upward correction of 30-35 points.
To Open Short Positions on EUR/USD:
Bears attempted to take control in the first half of the day, but with little success. The focus now shifts to defending the new resistance at 1.0489. To confirm their presence in the market, sellers need to achieve a false breakout at this level, which would signal the involvement of major players betting on a euro decline toward the end of the week.
The target will be support at 1.0446, where the moving averages, which favor buyers, are also located. A breakout and consolidation below this range, reinforced by strong U.S. economic data, followed by a retest from below, will provide another valid sell entry, aiming for a move to a new low at 1.0411. This would halt the development of the bullish market. The furthest objective will be the 1.0376 zone, where I will lock in profits.
If EUR/USD rises in the second half of the day and bears fail to act around 1.0489, which is more likely, buyers may push for another significant rally. In this case, I will postpone short positions until the next resistance test at 1.0531. I will sell from there only after an unsuccessful breakout attempt. If no downward movement occurs even at that level, I will look for short positions on a rebound from 1.0567, aiming for a downward correction of 30-35 points.
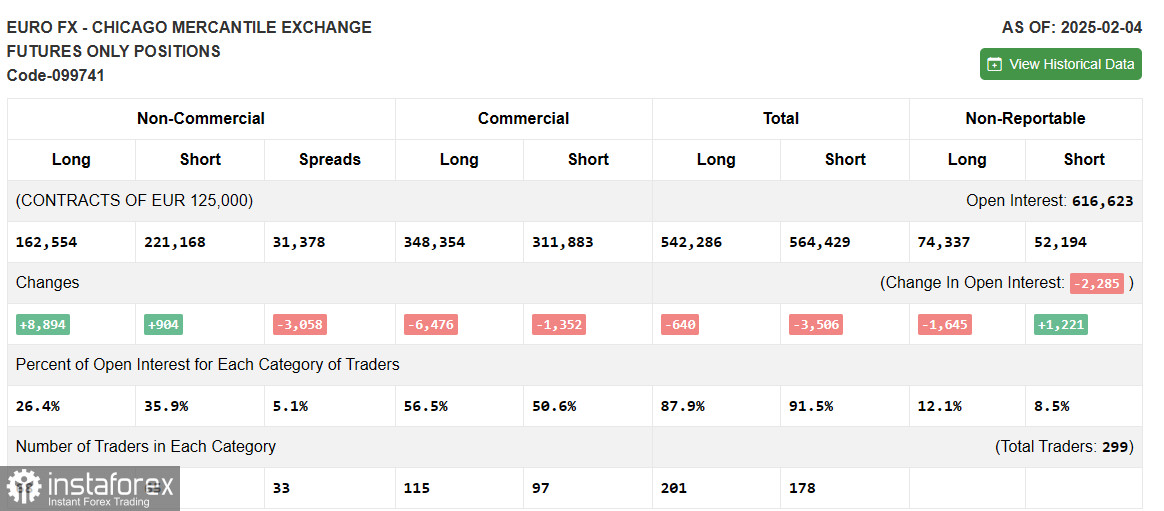
Commitments of Traders (COT) Report:
The COT report for February 4 showed an increase in both long and short positions. There was a slight uptick in interest in buying the euro following a decrease in concerns over a potential trade war escalation from Donald Trump. However, these figures do not yet reflect the strong recent U.S. labor market report and the new tariffs on steel and aluminum.
Thus, the situation remains uncertain. It is advisable not to rush into buying risky assets, as the trade war is only beginning. The COT report indicates that non-commercial long positions rose by 8,894 to 162,554, while short positions increased by only 904 to 221,168. As a result, the gap between long and short positions narrowed by 3,058.
Indicator Signals
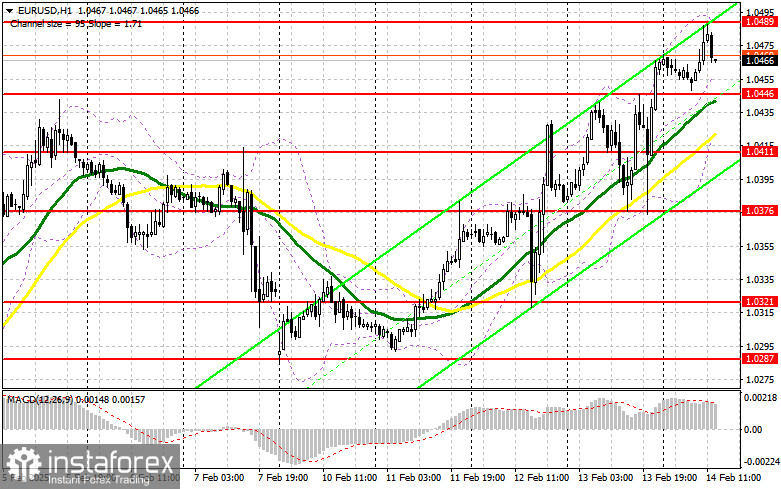
Moving AveragesThe pair is trading above the 30- and 50-day moving averages, indicating further euro growth.
Bollinger Bands:If the pair declines, the lower boundary of the indicator around 1.0411 will serve as support.
Indicator Descriptions:
- Moving Average (MA): Determines the current trend by smoothing out volatility and noise.
- 50-period MA (yellow on the chart).
- 30-period MA (green on the chart).
- MACD (Moving Average Convergence/Divergence):
- Fast EMA – 12-period.
- Slow EMA – 26-period.
- SMA – 9-period.
- Bollinger Bands: 20-period.
- Non-commercial traders: Speculators such as individual traders, hedge funds, and large institutions using the futures market for speculative purposes.
- Long non-commercial positions: The total long open positions held by non-commercial traders.
- Short non-commercial positions: The total short open positions held by non-commercial traders.
- Net non-commercial position: The difference between short and long positions of non-commercial traders.