Analysis of Friday's Trades
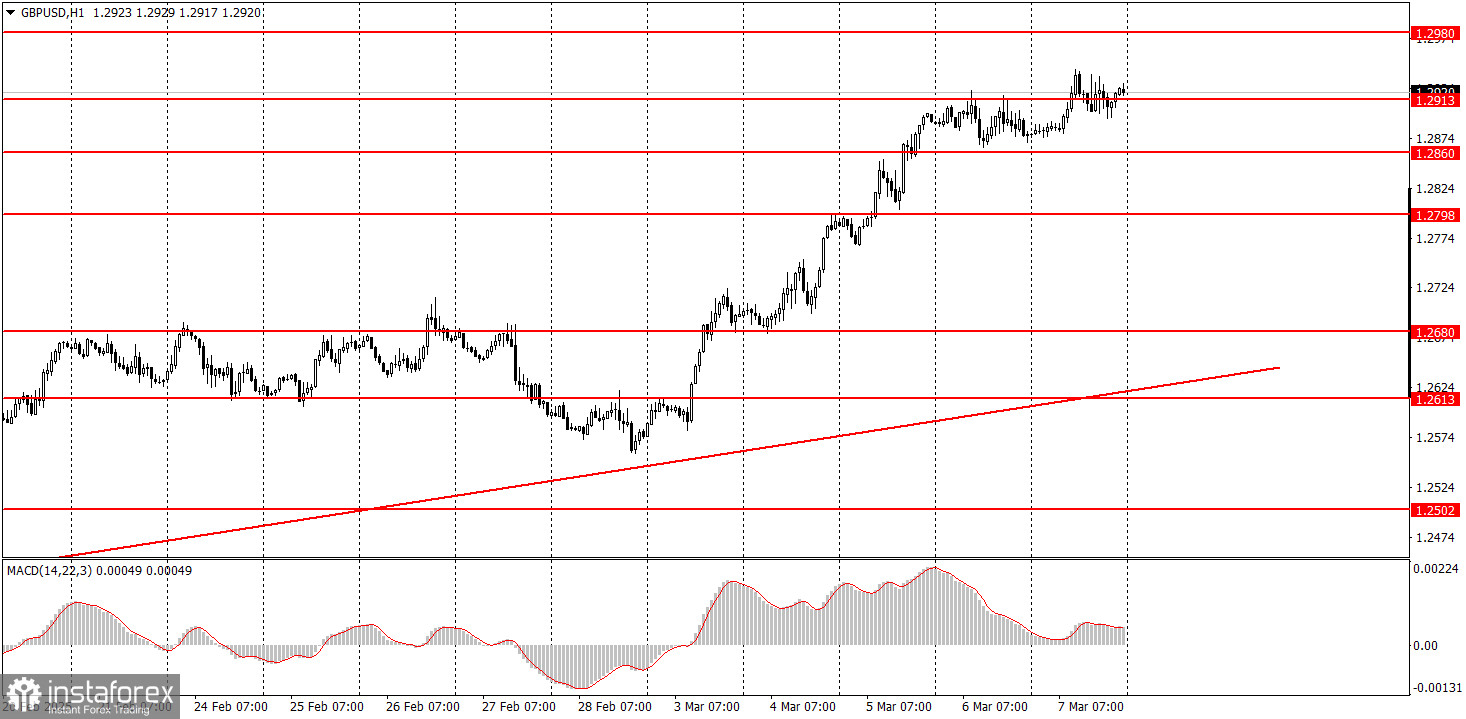
1H Chart of GBP/USD
The GBP/USD pair attempted to continue rising on Friday. However, it is important to note that there were no significant news events affecting the British pound during the first half of the day. The euro had some justification for its rise, as the Eurozone's Q4 GDP report was stronger than expected. However, the euro began its ascent before the report was released, rather than in reaction to it. In contrast, the pound lacked such support. So, why did the pound rise again? The answer is simple: Donald Trump.
Despite the U.S. president extending tariff exemptions for Canada and Mexico for another month, the market seems unphased. Investors are moving away from the U.S. dollar because they see no signs of improvement in the American economy. In reality, those improvements may not have been necessary, but Trump's policies could significantly slow economic growth and harm relations with key trading partners.
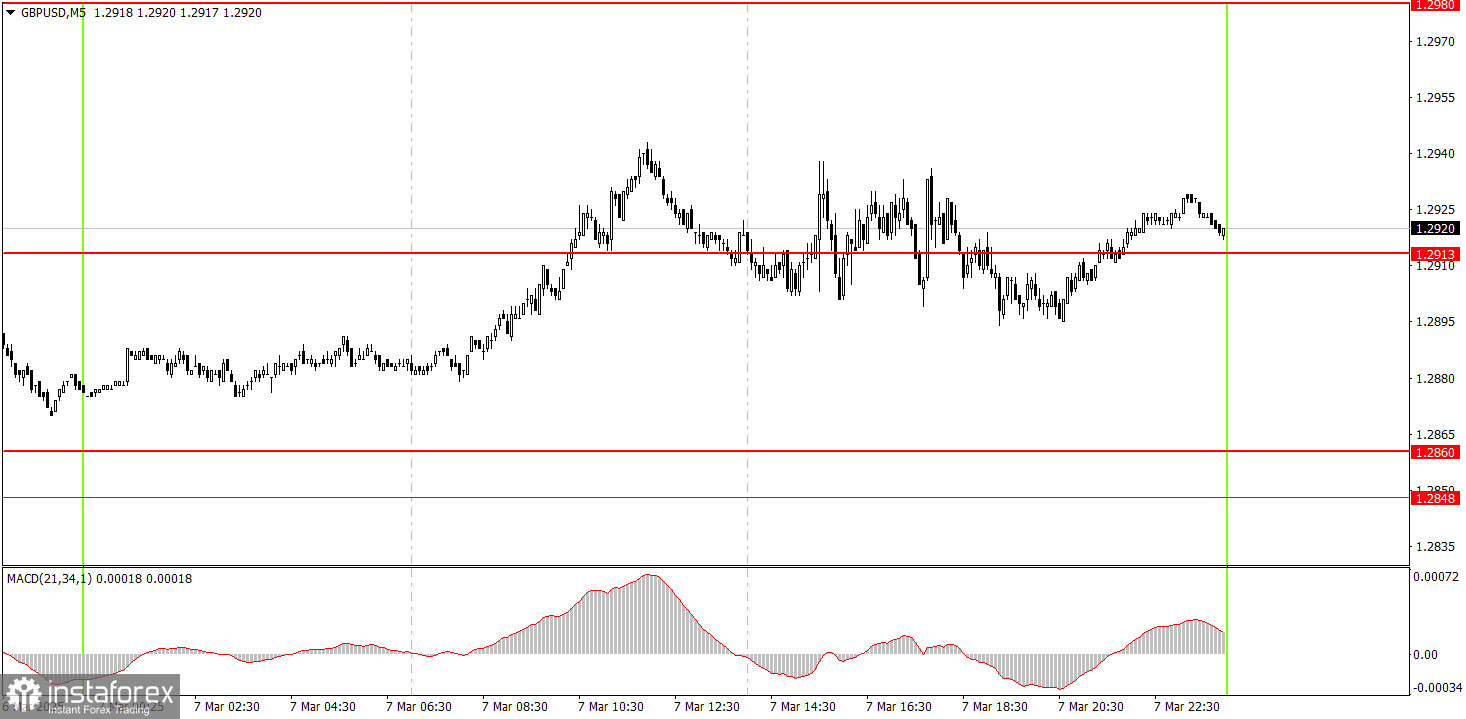
5M Chart of GBP/USD
On the 5-minute timeframe, several trading signals emerged around the 1.2913 level on Friday. However, this level was largely overlooked by traders. The pound simply followed the euro without responding to the technical levels. Beginners might have opened one or two trades near 1.2913, but both would likely have been closed at breakeven due to Stop Loss orders.
Trading Strategy for Monday:
In the hourly timeframe, GBP/USD could begin a short-term downtrend, but Trump is doing everything he can to prevent this. We still expect the pound to fall toward 1.1800 in the medium term, as this remains the most logical scenario. However, it is now important to wait for the daily timeframe's upward correction to end—and to see when and how it concludes. The U.S. dollar is at risk of breaking its 16-year uptrend.
On Monday, GBP/USD may continue rising if Trump continues to spread chaos and impose his conditions on the world. Even Japan has now fallen out of Trump's favor, and he is demanding a border revision from Canada.
On the 5-minute timeframe, the key levels for trading are 1.2301, 1.2372–1.2387, 1.2445, 1.2502–1.2508, 1.2547, 1.2613, 1.2680–1.2685, 1.2723, 1.2791–1.2798, 1.2848–1.2860, 1.2913, 1.2980–1.2993, and 1.3043. No major events are scheduled in the UK or the U.S. on Monday, but that doesn't mean it will be a "boring Monday." Trump works tirelessly, even on weekends. On Friday, he proposed renegotiating the 1908 border agreement with Canada and claimed that the U.S.-Japan trade deal benefits only Japan. There is little doubt that Trump will continue pressuring half the world, and the market may respond by selling more dollars.
Core Trading System Rules:
- Signal Strength: The shorter the time it takes for a signal to form (a rebound or breakout), the stronger the signal.
- False Signals: If two or more trades near a level result in false signals, subsequent signals from that level should be ignored.
- Flat Markets: In flat conditions, pairs may generate many false signals or none at all. It's better to stop trading at the first signs of a flat market.
- Trading Hours: Open trades between the start of the European session and the middle of the US session, then manually close all trades.
- MACD Signals: On the hourly timeframe, trade MACD signals only during periods of good volatility and a clear trend confirmed by trendlines or trend channels.
- Close Levels: If two levels are too close (5–20 pips apart), treat them as a support or resistance zone.
- Stop Loss: Set a Stop Loss to breakeven after the price moves 20 pips in the desired direction.
Key Chart Elements:
Support and Resistance Levels: These are target levels for opening or closing positions and can also serve as points for placing Take Profit orders.
Red Lines: Channels or trendlines indicating the current trend and the preferred direction for trading.
MACD Indicator (14,22,3): A histogram and signal line used as a supplementary source of trading signals.
Important Events and Reports: Found in the economic calendar, these can heavily influence price movements. Exercise caution or exit the market during their release to avoid sharp reversals.
Forex trading beginners should remember that not every trade will be profitable. Developing a clear strategy and practicing proper money management are essential for long-term trading success.